

Road safety data - Invercargill City 2010 - NZ Transport Agency
Road safety data - Invercargill City 2010 - NZ Transport Agency
Road safety data - Invercargill City 2010 - NZ Transport Agency

You also want an ePaper? Increase the reach of your titles
YUMPU automatically turns print PDFs into web optimized ePapers that Google loves.
<strong>Invercargill</strong> <strong>City</strong> <strong>Road</strong> Safety Report 2005-2009<br />
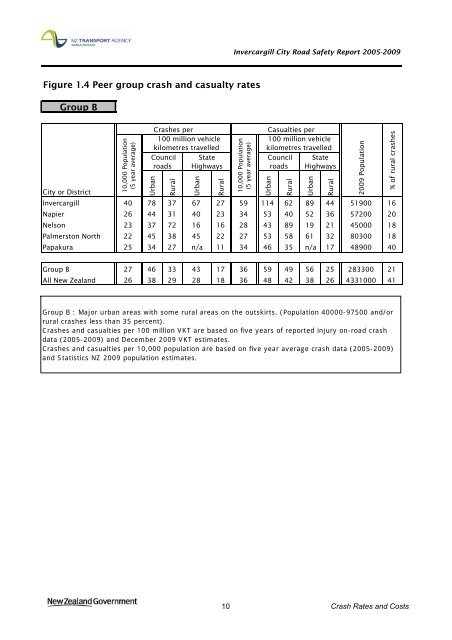
Figure 1.4 Peer group crash and casualty rates<br />
Group B<br />
10,000 Population<br />
(5 year average)<br />
Crashes per Casualties per<br />
100 million vehicle<br />
kilometres travelled<br />
Council<br />
roads<br />
Urban<br />
Rural<br />
State<br />
Highways<br />
Urban<br />
Rural<br />
<strong>City</strong> or District<br />
<strong>Invercargill</strong> 40 78 37 67 27 59 114 62 89 44 51900 16<br />
Napier 26 44 31 40 23 34 53 40 52 36 57200 20<br />
Nelson 23 37 72 16 16 28 43 89 19 21 45000 18<br />
Palmerston North 22 45 38 45 22 27 53 58 61 32 80300 18<br />
Papakura 25 34 27 n/a 11 34 46 35 n/a 17 48900 40<br />
10,000 Population<br />
(5 year average)<br />
100 million vehicle<br />
kilometres travelled<br />
Urban<br />
Council<br />
roads<br />
Rural<br />
State<br />
Highways<br />
Urban<br />
Rural<br />
2009 Population<br />
% of rural crashes<br />
Group B 27 46 33 43 17 36 59 49 56 25 283300 21<br />
All New Zealand 26 38 29 28 18 36 48 42 38 26 4331000 41<br />
Group B : Major urban areas with some rural areas on the outskirts. (Population 40000-97500 and/or<br />
rural crashes less than 35 percent).<br />
Crashes and casualties per 100 million VKT are based on five years of reported injury on-road crash<br />
<strong>data</strong> (2005-2009) and December 2009 VKT estimates.<br />
Crashes and casualties per 10,000 population are based on five year average crash <strong>data</strong> (2005-2009)<br />
and Statistics <strong>NZ</strong> 2009 population estimates.<br />
10 Crash Rates and Costs


