

Road safety data - Invercargill City 2010 - NZ Transport Agency
Road safety data - Invercargill City 2010 - NZ Transport Agency
Road safety data - Invercargill City 2010 - NZ Transport Agency

You also want an ePaper? Increase the reach of your titles
YUMPU automatically turns print PDFs into web optimized ePapers that Google loves.
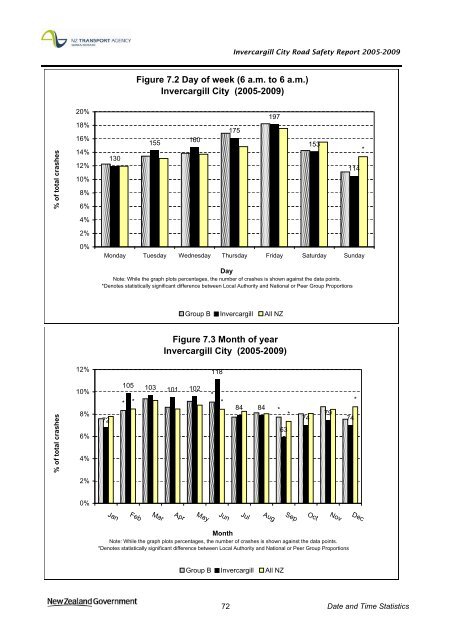
<strong>Invercargill</strong> <strong>City</strong> <strong>Road</strong> Safety Report 2005-2009<br />
Figure 7.2 Day of week (6 a.m. to 6 a.m.)<br />
<strong>Invercargill</strong> <strong>City</strong> (2005-2009)<br />
% of total crashes<br />
20%<br />
18%<br />
16%<br />
14%<br />
12%<br />
10%<br />
8%<br />
6%<br />
130<br />
155<br />
160<br />
175<br />
197<br />
153<br />
114<br />
*<br />
4%<br />
2%<br />
69<br />
0%<br />
Monday Tuesday Wednesday Thursday Friday Saturday Sunday<br />
Day<br />
Note: While the graph plots percentages, the number of crashes is shown against the <strong>data</strong> points.<br />
*Denotes statistically significant difference between Local Authority and National or Peer Group Proportions<br />
Group B <strong>Invercargill</strong> All <strong>NZ</strong><br />
Figure 7.3 Month of year<br />
<strong>Invercargill</strong> <strong>City</strong> (2005-2009)<br />
12%<br />
118<br />
% of total crashes<br />
10%<br />
8%<br />
6%<br />
4%<br />
72<br />
105<br />
*<br />
*<br />
103<br />
101<br />
102<br />
*<br />
*<br />
84<br />
84<br />
*<br />
63<br />
*<br />
74<br />
79<br />
74<br />
*<br />
2%<br />
0%<br />
Jan<br />
Feb<br />
Mar<br />
Apr<br />
May<br />
Jun<br />
Jul<br />
Aug<br />
Sep<br />
Oct<br />
Nov<br />
Dec<br />
Month<br />
Note: While the graph plots percentages, the number of crashes is shown against the <strong>data</strong> points.<br />
*Denotes statistically significant difference between Local Authority and National or Peer Group Proportions<br />
Group B <strong>Invercargill</strong> All <strong>NZ</strong><br />
72 Date and Time Statistics


