

Road safety data - Invercargill City 2010 - NZ Transport Agency
Road safety data - Invercargill City 2010 - NZ Transport Agency
Road safety data - Invercargill City 2010 - NZ Transport Agency

You also want an ePaper? Increase the reach of your titles
YUMPU automatically turns print PDFs into web optimized ePapers that Google loves.
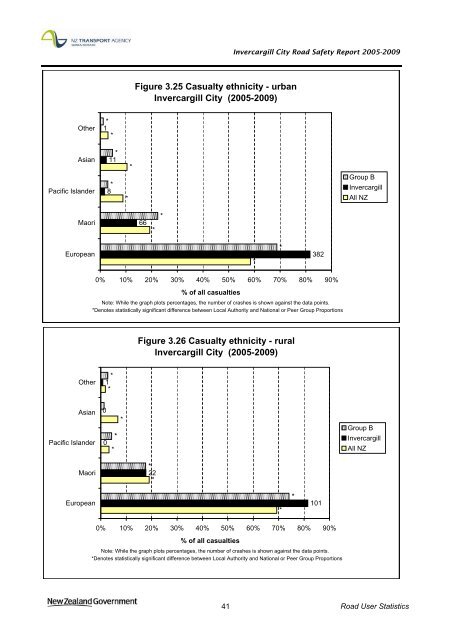
<strong>Invercargill</strong> <strong>City</strong> <strong>Road</strong> Safety Report 2005-2009<br />
Figure 3.25 Casualty ethnicity - urban<br />
<strong>Invercargill</strong> <strong>City</strong> (2005-2009)<br />
Other<br />
*<br />
1<br />
*<br />
Asian<br />
Pacific Islander<br />
*<br />
11<br />
*<br />
8<br />
*<br />
*<br />
Group B<br />
<strong>Invercargill</strong><br />
All <strong>NZ</strong><br />
Maori<br />
66<br />
*<br />
*<br />
European<br />
*<br />
*<br />
382<br />
0% 10% 20% 30% 40% 50% 60% 70% 80% 90%<br />
% of all casualties<br />
Note: While the graph plots percentages, the number of crashes is shown against the <strong>data</strong> points.<br />
*Denotes statistically significant difference between Local Authority and National or Peer Group Proportions<br />
Figure 3.26 Casualty ethnicity - rural<br />
<strong>Invercargill</strong> <strong>City</strong> (2005-2009)<br />
Other<br />
*<br />
1<br />
*<br />
Asian<br />
Pacific Islander<br />
0<br />
0<br />
*<br />
*<br />
*<br />
Group B<br />
<strong>Invercargill</strong><br />
All <strong>NZ</strong><br />
Maori<br />
*<br />
22<br />
*<br />
European<br />
*<br />
*<br />
101<br />
0% 10% 20% 30% 40% 50% 60% 70% 80% 90%<br />
% of all casualties<br />
Note: While the graph plots percentages, the number of crashes is shown against the <strong>data</strong> points.<br />
*Denotes statistically significant difference between Local Authority and National or Peer Group Proportions<br />
41 <strong>Road</strong> User Statistics


