

Road safety data - Invercargill City 2010 - NZ Transport Agency
Road safety data - Invercargill City 2010 - NZ Transport Agency
Road safety data - Invercargill City 2010 - NZ Transport Agency

You also want an ePaper? Increase the reach of your titles
YUMPU automatically turns print PDFs into web optimized ePapers that Google loves.
<strong>Invercargill</strong> <strong>City</strong> <strong>Road</strong> Safety Report 2005-2009<br />
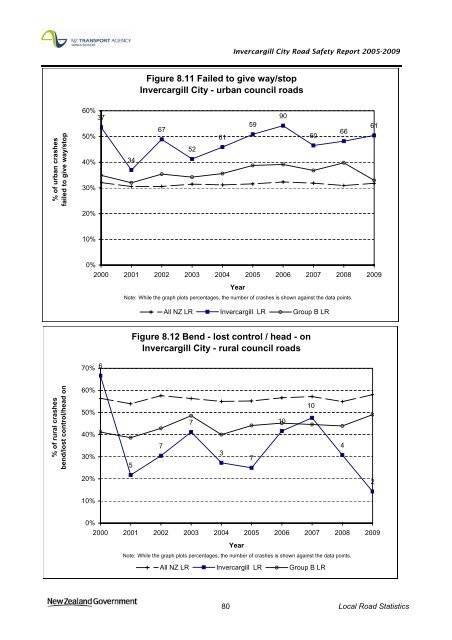
Figure 8.11 Failed to give way/stop<br />
<strong>Invercargill</strong> <strong>City</strong> - urban council roads<br />
% of urban crashes<br />
failed to give way/stop<br />
60%<br />
37<br />
50%<br />
40%<br />
30%<br />
34<br />
67<br />
52<br />
61<br />
59<br />
90<br />
60<br />
66<br />
61<br />
20%<br />
10%<br />
0%<br />
2000 2001 2002 2003 2004 2005 2006 2007 2008 2009<br />
Year<br />
Note: While the graph plots percentages, the number of crashes is shown against the <strong>data</strong> points.<br />
All <strong>NZ</strong> LR <strong>Invercargill</strong> LR Group B LR<br />
Figure 8.12 Bend - lost control / head - on<br />
<strong>Invercargill</strong> <strong>City</strong> - rural council roads<br />
70%<br />
6<br />
% of rural crashes<br />
bend/lost control/head on<br />
60%<br />
50%<br />
40%<br />
30%<br />
5<br />
7<br />
7<br />
3<br />
7<br />
10<br />
10<br />
4<br />
20%<br />
2<br />
10%<br />
0%<br />
2000 2001 2002 2003 2004 2005 2006 2007 2008 2009<br />
Year<br />
Note: While the graph plots percentages, the number of crashes is shown against the <strong>data</strong> points.<br />
All <strong>NZ</strong> LR <strong>Invercargill</strong> LR Group B LR<br />
80 Local <strong>Road</strong> Statistics


