

Road safety data - Invercargill City 2010 - NZ Transport Agency
Road safety data - Invercargill City 2010 - NZ Transport Agency
Road safety data - Invercargill City 2010 - NZ Transport Agency

You also want an ePaper? Increase the reach of your titles
YUMPU automatically turns print PDFs into web optimized ePapers that Google loves.
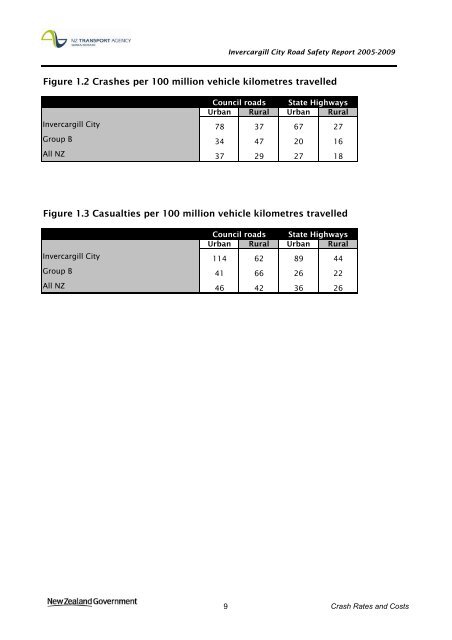
<strong>Invercargill</strong> <strong>City</strong> <strong>Road</strong> Safety Report 2005-2009<br />
Figure 1.2 Crashes per 100 million vehicle kilometres travelled<br />
Council roads State Highways<br />
Urban Rural Urban Rural<br />
<strong>Invercargill</strong> <strong>City</strong> 78 37 67 27<br />
Group B 34 47 20 16<br />
All <strong>NZ</strong> 37 29 27 18<br />
Figure 1.3 Casualties per 100 million vehicle kilometres travelled<br />
Council roads State Highways<br />
Urban Rural Urban Rural<br />
<strong>Invercargill</strong> <strong>City</strong> 114 62 89 44<br />
Group B 41 66 26 22<br />
All <strong>NZ</strong> 46 42 36 26<br />
9 Crash Rates and Costs


