

Road safety data - Invercargill City 2010 - NZ Transport Agency
Road safety data - Invercargill City 2010 - NZ Transport Agency
Road safety data - Invercargill City 2010 - NZ Transport Agency

You also want an ePaper? Increase the reach of your titles
YUMPU automatically turns print PDFs into web optimized ePapers that Google loves.
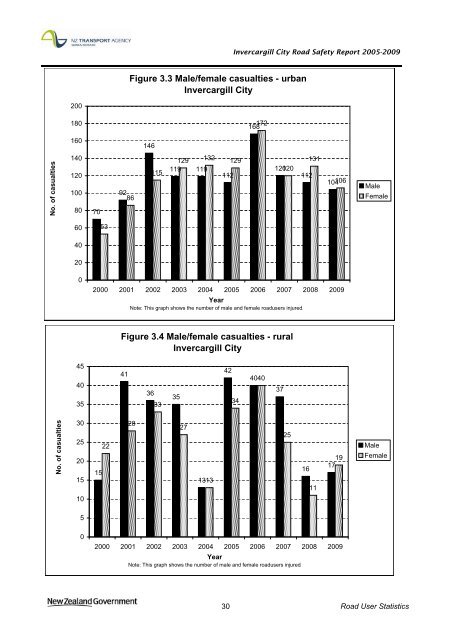
<strong>Invercargill</strong> <strong>City</strong> <strong>Road</strong> Safety Report 2005-2009<br />
Figure 3.3 Male/female casualties - urban<br />
<strong>Invercargill</strong> <strong>City</strong><br />
200<br />
180<br />
172<br />
168<br />
160<br />
146<br />
No. of casualties<br />
140<br />
120<br />
100<br />
80<br />
70<br />
92<br />
86<br />
115<br />
129 132 129<br />
119 119<br />
112<br />
120 120<br />
112<br />
131<br />
104 106<br />
Male<br />
Female<br />
60<br />
53<br />
40<br />
20<br />
0<br />
2000 2001 2002 2003 2004 2005 2006 2007 2008 2009<br />
Year<br />
Note: This graph shows the number of male and female roadusers injured.<br />
Figure 3.4 Male/female casualties - rural<br />
<strong>Invercargill</strong> <strong>City</strong><br />
45<br />
40<br />
35<br />
41<br />
36<br />
33<br />
35<br />
42<br />
34<br />
40 40<br />
37<br />
No. of casualties<br />
30<br />
25<br />
20<br />
15<br />
10<br />
15<br />
22<br />
28<br />
27<br />
13 13<br />
25<br />
16<br />
11<br />
19<br />
17<br />
Male<br />
Female<br />
5<br />
0<br />
2000 2001 2002 2003 2004 2005 2006 2007 2008 2009<br />
Year<br />
Note: This graph shows the number of male and female roadusers injured.<br />
30 <strong>Road</strong> User Statistics


