

Road safety data - Invercargill City 2010 - NZ Transport Agency
Road safety data - Invercargill City 2010 - NZ Transport Agency
Road safety data - Invercargill City 2010 - NZ Transport Agency

Create successful ePaper yourself
Turn your PDF publications into a flip-book with our unique Google optimized e-Paper software.
<strong>Invercargill</strong> <strong>City</strong> <strong>Road</strong> Safety Report 2005-2009<br />
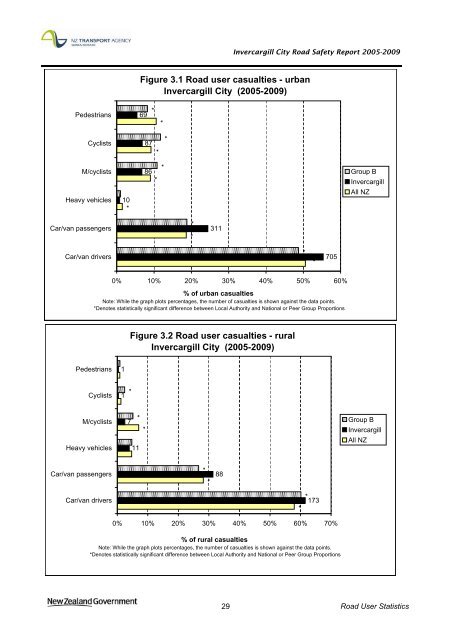
Figure 3.1 <strong>Road</strong> user casualties - urban<br />
<strong>Invercargill</strong> <strong>City</strong> (2005-2009)<br />
Pedestrians<br />
69<br />
*<br />
*<br />
*<br />
*<br />
*<br />
Cyclists<br />
87<br />
*<br />
M/cyclists<br />
86<br />
*<br />
Group B<br />
*<br />
<strong>Invercargill</strong><br />
Heavy vehicles<br />
10<br />
All <strong>NZ</strong><br />
Car/van passengers<br />
*<br />
311<br />
Car/van drivers<br />
*<br />
*<br />
705<br />
0% 10% 20% 30% 40% 50% 60%<br />
% of urban casualties<br />
Note: While the graph plots percentages, the number of casualties is shown against the <strong>data</strong> points.<br />
*Denotes statistically significant difference between Local Authority and National or Peer Group Proportions<br />
Figure 3.2 <strong>Road</strong> user casualties - rural<br />
<strong>Invercargill</strong> <strong>City</strong> (2005-2009)<br />
Pedestrians<br />
1<br />
Cyclists<br />
1<br />
*<br />
M/cyclists<br />
Heavy vehicles<br />
7<br />
*<br />
*<br />
11<br />
Group B<br />
<strong>Invercargill</strong><br />
All <strong>NZ</strong><br />
Car/van passengers<br />
*<br />
*<br />
88<br />
Car/van drivers<br />
*<br />
*<br />
173<br />
0% 10% 20% 30% 40% 50% 60% 70%<br />
% of rural casualties<br />
Note: While the graph plots percentages, the number of casualties is shown against the <strong>data</strong> points.<br />
*Denotes statistically significant difference between Local Authority and National or Peer Group Proportions<br />
29 <strong>Road</strong> User Statistics


