Road safety data - Invercargill City 2010 - NZ Transport Agency
Road safety data - Invercargill City 2010 - NZ Transport Agency
Road safety data - Invercargill City 2010 - NZ Transport Agency
You also want an ePaper? Increase the reach of your titles
YUMPU automatically turns print PDFs into web optimized ePapers that Google loves.
<strong>Invercargill</strong> <strong>City</strong> <strong>Road</strong> Safety Report 2005-2009<br />
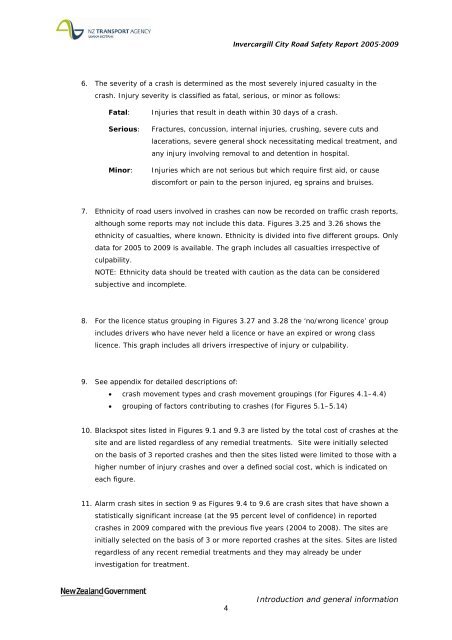
6. The severity of a crash is determined as the most severely injured casualty in the<br />
crash. Injury severity is classified as fatal, serious, or minor as follows:<br />
Fatal:<br />
Serious:<br />
Minor:<br />
Injuries that result in death within 30 days of a crash.<br />
Fractures, concussion, internal injuries, crushing, severe cuts and<br />
lacerations, severe general shock necessitating medical treatment, and<br />
any injury involving removal to and detention in hospital.<br />
Injuries which are not serious but which require first aid, or cause<br />
discomfort or pain to the person injured, eg sprains and bruises.<br />
7. Ethnicity of road users involved in crashes can now be recorded on traffic crash reports,<br />
although some reports may not include this <strong>data</strong>. Figures 3.25 and 3.26 shows the<br />
ethnicity of casualties, where known. Ethnicity is divided into five different groups. Only<br />
<strong>data</strong> for 2005 to 2009 is available. The graph includes all casualties irrespective of<br />
culpability.<br />
NOTE: Ethnicity <strong>data</strong> should be treated with caution as the <strong>data</strong> can be considered<br />
subjective and incomplete.<br />
8. For the licence status grouping in Figures 3.27 and 3.28 the ‘no/wrong licence’ group<br />
includes drivers who have never held a licence or have an expired or wrong class<br />
licence. This graph includes all drivers irrespective of injury or culpability.<br />
9. See appendix for detailed descriptions of:<br />
• crash movement types and crash movement groupings (for Figures 4.1–4.4)<br />
• grouping of factors contributing to crashes (for Figures 5.1–5.14)<br />
10. Blackspot sites listed in Figures 9.1 and 9.3 are listed by the total cost of crashes at the<br />
site and are listed regardless of any remedial treatments. Site were initially selected<br />
on the basis of 3 reported crashes and then the sites listed were limited to those with a<br />
higher number of injury crashes and over a defined social cost, which is indicated on<br />
each figure.<br />
11. Alarm crash sites in section 9 as Figures 9.4 to 9.6 are crash sites that have shown a<br />
statistically significant increase (at the 95 percent level of confidence) in reported<br />
crashes in 2009 compared with the previous five years (2004 to 2008). The sites are<br />
initially selected on the basis of 3 or more reported crashes at the sites. Sites are listed<br />
regardless of any recent remedial treatments and they may already be under<br />
investigation for treatment.<br />
4<br />
Introduction and general information


