

Road safety data - Invercargill City 2010 - NZ Transport Agency
Road safety data - Invercargill City 2010 - NZ Transport Agency
Road safety data - Invercargill City 2010 - NZ Transport Agency

You also want an ePaper? Increase the reach of your titles
YUMPU automatically turns print PDFs into web optimized ePapers that Google loves.
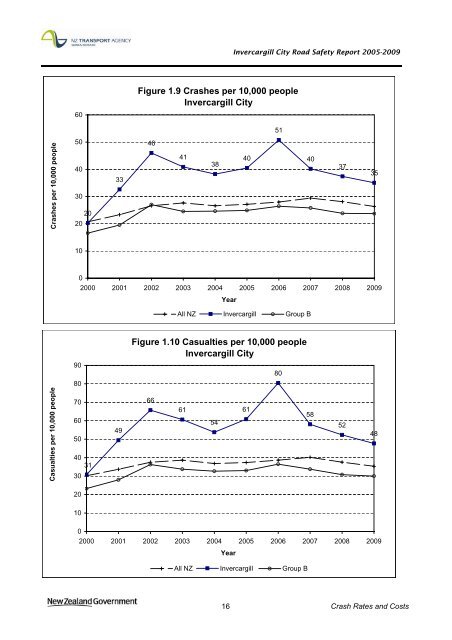
<strong>Invercargill</strong> <strong>City</strong> <strong>Road</strong> Safety Report 2005-2009<br />
Figure 1.9 Crashes per 10,000 people<br />
<strong>Invercargill</strong> <strong>City</strong><br />
60<br />
51<br />
Crashes per 10,000 people<br />
50<br />
40<br />
30<br />
20<br />
20<br />
33<br />
46<br />
41<br />
38<br />
40<br />
40<br />
37<br />
35<br />
10<br />
0<br />
2000 2001 2002 2003 2004 2005 2006 2007 2008 2009<br />
Year<br />
All <strong>NZ</strong> <strong>Invercargill</strong> Group B<br />
Figure 1.10 Casualties per 10,000 people<br />
<strong>Invercargill</strong> <strong>City</strong><br />
90<br />
80<br />
80<br />
Casualties per 10,000 people<br />
70<br />
60<br />
50<br />
40<br />
31<br />
30<br />
49<br />
66<br />
61<br />
54<br />
61<br />
58<br />
52<br />
48<br />
20<br />
10<br />
0<br />
2000 2001 2002 2003 2004 2005 2006 2007 2008 2009<br />
Year<br />
All <strong>NZ</strong> <strong>Invercargill</strong> Group B<br />
16 Crash Rates and Costs


