

Road safety data - Invercargill City 2010 - NZ Transport Agency
Road safety data - Invercargill City 2010 - NZ Transport Agency
Road safety data - Invercargill City 2010 - NZ Transport Agency

You also want an ePaper? Increase the reach of your titles
YUMPU automatically turns print PDFs into web optimized ePapers that Google loves.
<strong>Invercargill</strong> <strong>City</strong> <strong>Road</strong> Safety Report 2005-2009<br />
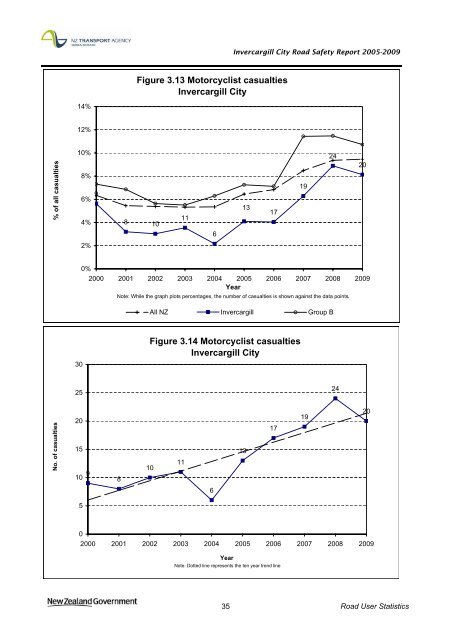
Figure 3.13 Motorcyclist casualties<br />
<strong>Invercargill</strong> <strong>City</strong><br />
14%<br />
12%<br />
% of all casualties<br />
10%<br />
8%<br />
6%<br />
4%<br />
9<br />
8<br />
10<br />
11<br />
13<br />
17<br />
19<br />
24<br />
20<br />
6<br />
2%<br />
0%<br />
2000 2001 2002 2003 2004 2005 2006 2007 2008 2009<br />
Year<br />
Note: While the graph plots percentages, the number of casualties is shown against the <strong>data</strong> points.<br />
All <strong>NZ</strong> <strong>Invercargill</strong> Group B<br />
30<br />
Figure 3.14 Motorcyclist casualties<br />
<strong>Invercargill</strong> <strong>City</strong><br />
25<br />
24<br />
No. of casualties<br />
20<br />
15<br />
10<br />
9<br />
8<br />
10<br />
11<br />
13<br />
17<br />
19<br />
20<br />
6<br />
5<br />
0<br />
2000 2001 2002 2003 2004 2005 2006 2007 2008 2009<br />
Year<br />
Note: Dotted line represents the ten year trend line<br />
35 <strong>Road</strong> User Statistics


