

Road safety data - Invercargill City 2010 - NZ Transport Agency
Road safety data - Invercargill City 2010 - NZ Transport Agency
Road safety data - Invercargill City 2010 - NZ Transport Agency

You also want an ePaper? Increase the reach of your titles
YUMPU automatically turns print PDFs into web optimized ePapers that Google loves.
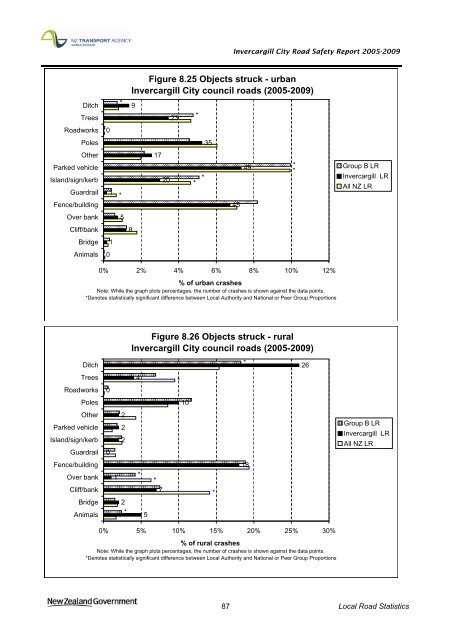
<strong>Invercargill</strong> <strong>City</strong> <strong>Road</strong> Safety Report 2005-2009<br />
Figure 8.25 Objects struck - urban<br />
<strong>Invercargill</strong> <strong>City</strong> council roads (2005-2009)<br />
Ditch<br />
Trees<br />
*<br />
*<br />
9<br />
23<br />
*<br />
<strong>Road</strong>works<br />
0<br />
Poles<br />
35<br />
Other<br />
Parked vehicle<br />
Island/sign/kerb<br />
Guardrail<br />
Fence/building<br />
1<br />
*<br />
17<br />
20<br />
*<br />
*<br />
45<br />
49<br />
*<br />
*<br />
Group B LR<br />
<strong>Invercargill</strong> LR<br />
All <strong>NZ</strong> LR<br />
Over bank<br />
5<br />
Cliff/bank<br />
8<br />
Bridge<br />
1<br />
Animals<br />
0<br />
0% 2% 4% 6% 8% 10% 12%<br />
% of urban crashes<br />
Note: While the graph plots percentages, the number of crashes is shown against the <strong>data</strong> points.<br />
*Denotes statistically significant difference between Local Authority and National or Peer Group Proportions<br />
Ditch<br />
Trees<br />
<strong>Road</strong>works<br />
Poles<br />
Other<br />
Parked vehicle<br />
Island/sign/kerb<br />
Guardrail<br />
0<br />
0<br />
2<br />
2<br />
2<br />
Figure 8.26 Objects struck - rural<br />
<strong>Invercargill</strong> <strong>City</strong> council roads (2005-2009)<br />
4<br />
*<br />
10<br />
Fence/building<br />
18<br />
Over bank 1<br />
*<br />
*<br />
Cliff/bank<br />
7<br />
*<br />
Bridge 2<br />
Animals<br />
*<br />
* 5<br />
0% 5% 10% 15% 20% 25% 30%<br />
% of rural crashes<br />
Note: While the graph plots percentages, the number of crashes is shown against the <strong>data</strong> points.<br />
*Denotes statistically significant difference between Local Authority and National or Peer Group Proportions<br />
*<br />
*<br />
26<br />
Group B LR<br />
<strong>Invercargill</strong> LR<br />
All <strong>NZ</strong> LR<br />
87 Local <strong>Road</strong> Statistics


