

Road safety data - Invercargill City 2010 - NZ Transport Agency
Road safety data - Invercargill City 2010 - NZ Transport Agency
Road safety data - Invercargill City 2010 - NZ Transport Agency

Create successful ePaper yourself
Turn your PDF publications into a flip-book with our unique Google optimized e-Paper software.
<strong>Invercargill</strong> <strong>City</strong> <strong>Road</strong> Safety Report 2005-2009<br />
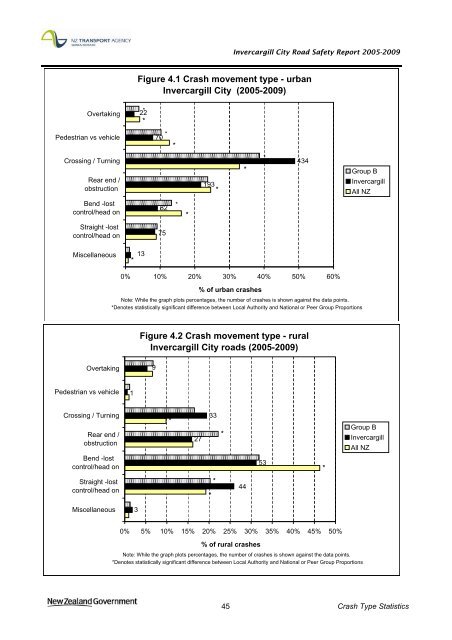
Figure 4.1 Crash movement type - urban<br />
<strong>Invercargill</strong> <strong>City</strong> (2005-2009)<br />
Overtaking<br />
22<br />
*<br />
*<br />
Pedestrian vs vehicle<br />
70<br />
*<br />
*<br />
Crossing / Turning<br />
Rear end /<br />
obstruction<br />
193<br />
*<br />
*<br />
*<br />
434<br />
Group B<br />
<strong>Invercargill</strong><br />
All <strong>NZ</strong><br />
Bend -lost<br />
control/head on<br />
82<br />
*<br />
*<br />
Straight -lost<br />
control/head on<br />
75<br />
Miscellaneous<br />
*<br />
13<br />
0% 10% 20% 30% 40% 50% 60%<br />
% of urban crashes<br />
Note: While the graph plots percentages, the number of crashes is shown against the <strong>data</strong> points.<br />
*Denotes statistically significant difference between Local Authority and National or Peer Group Proportions<br />
Figure 4.2 Crash movement type - rural<br />
<strong>Invercargill</strong> <strong>City</strong> roads (2005-2009)<br />
Overtaking<br />
9<br />
Pedestrian vs vehicle<br />
1<br />
Crossing / Turning<br />
Rear end /<br />
obstruction<br />
Bend -lost<br />
control/head on<br />
*<br />
27<br />
33<br />
*<br />
53<br />
*<br />
Group B<br />
<strong>Invercargill</strong><br />
All <strong>NZ</strong><br />
Straight -lost<br />
control/head on<br />
*<br />
*<br />
44<br />
Miscellaneous<br />
3<br />
0% 5% 10% 15% 20% 25% 30% 35% 40% 45% 50%<br />
% of rural crashes<br />
Note: While the graph plots percentages, the number of crashes is shown against the <strong>data</strong> points.<br />
*Denotes statistically significant difference between Local Authority and National or Peer Group Proportions<br />
45 Crash Type Statistics


