

Road safety data - Invercargill City 2010 - NZ Transport Agency
Road safety data - Invercargill City 2010 - NZ Transport Agency
Road safety data - Invercargill City 2010 - NZ Transport Agency

You also want an ePaper? Increase the reach of your titles
YUMPU automatically turns print PDFs into web optimized ePapers that Google loves.
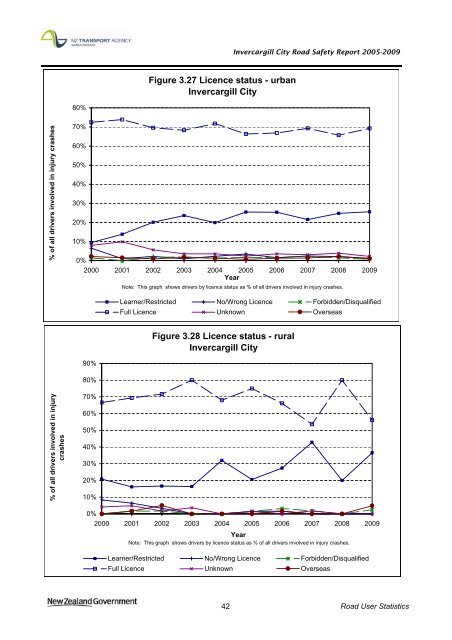
<strong>Invercargill</strong> <strong>City</strong> <strong>Road</strong> Safety Report 2005-2009<br />
Figure 3.27 Licence status - urban<br />
<strong>Invercargill</strong> <strong>City</strong><br />
80%<br />
% of all drivers involved in injury crashes<br />
70%<br />
60%<br />
50%<br />
40%<br />
30%<br />
20%<br />
10%<br />
0%<br />
2000 2001 2002 2003 2004 2005 2006 2007 2008 2009<br />
Year<br />
Note: This graph shows drivers by licence status as % of all drivers involved in injury crashes.<br />
Learner/Restricted No/Wrong Licence Forbidden/Disqualified<br />
Full Licence Unknown Overseas<br />
Figure 3.28 Licence status - rural<br />
<strong>Invercargill</strong> <strong>City</strong><br />
90%<br />
80%<br />
% of all drivers involved in injury<br />
crashes<br />
70%<br />
60%<br />
50%<br />
40%<br />
30%<br />
20%<br />
10%<br />
0%<br />
2000 2001 2002 2003 2004 2005 2006 2007 2008 2009<br />
Year<br />
Note: This graph shows drivers by licence status as % of all drivers involved in injury crashes.<br />
Learner/Restricted No/Wrong Licence Forbidden/Disqualified<br />
Full Licence Unknown Overseas<br />
42 <strong>Road</strong> User Statistics


