

Road safety data - Invercargill City 2010 - NZ Transport Agency
Road safety data - Invercargill City 2010 - NZ Transport Agency
Road safety data - Invercargill City 2010 - NZ Transport Agency

Create successful ePaper yourself
Turn your PDF publications into a flip-book with our unique Google optimized e-Paper software.
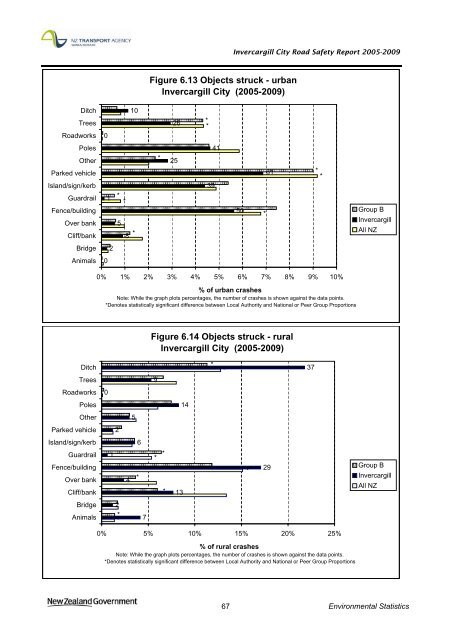
<strong>Invercargill</strong> <strong>City</strong> <strong>Road</strong> Safety Report 2005-2009<br />
Figure 6.13 Objects struck - urban<br />
<strong>Invercargill</strong> <strong>City</strong> (2005-2009)<br />
Ditch<br />
Trees<br />
<strong>Road</strong>works<br />
0<br />
*<br />
10<br />
26<br />
*<br />
*<br />
Poles<br />
Other<br />
Parked vehicle<br />
Island/sign/kerb<br />
Guardrail<br />
Fence/building<br />
Over bank<br />
Cliff/bank<br />
1<br />
*<br />
*<br />
5<br />
8<br />
*<br />
*<br />
25<br />
41<br />
39<br />
50<br />
*<br />
61<br />
*<br />
*<br />
Group B<br />
<strong>Invercargill</strong><br />
All <strong>NZ</strong><br />
Bridge<br />
2<br />
Animals<br />
0<br />
0% 1% 2% 3% 4% 5% 6% 7% 8% 9% 10%<br />
% of urban crashes<br />
Note: While the graph plots percentages, the number of crashes is shown against the <strong>data</strong> points.<br />
*Denotes statistically significant difference between Local Authority and National or Peer Group Proportions<br />
Ditch<br />
Trees<br />
<strong>Road</strong>works<br />
Poles<br />
Other<br />
Parked vehicle<br />
Island/sign/kerb<br />
Guardrail<br />
Fence/building<br />
Over bank<br />
Cliff/bank<br />
Bridge<br />
Animals<br />
0<br />
1<br />
2<br />
2<br />
*<br />
*<br />
4<br />
5<br />
6<br />
*<br />
7<br />
Figure 6.14 Objects struck - rural<br />
<strong>Invercargill</strong> <strong>City</strong> (2005-2009)<br />
9<br />
*<br />
*<br />
*<br />
13<br />
14<br />
*<br />
0% 5% 10% 15% 20% 25%<br />
*<br />
% of rural crashes<br />
Note: While the graph plots percentages, the number of crashes is shown against the <strong>data</strong> points.<br />
*Denotes statistically significant difference between Local Authority and National or Peer Group Proportions<br />
*<br />
29<br />
37<br />
Group B<br />
<strong>Invercargill</strong><br />
All <strong>NZ</strong><br />
67 Environmental Statistics


