

Road safety data - Invercargill City 2010 - NZ Transport Agency
Road safety data - Invercargill City 2010 - NZ Transport Agency
Road safety data - Invercargill City 2010 - NZ Transport Agency

Create successful ePaper yourself
Turn your PDF publications into a flip-book with our unique Google optimized e-Paper software.
<strong>Invercargill</strong> <strong>City</strong> <strong>Road</strong> Safety Report 2005-2009<br />
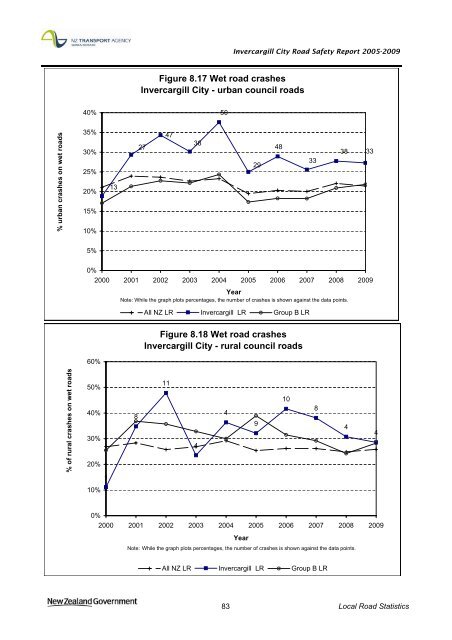
Figure 8.17 Wet road crashes<br />
<strong>Invercargill</strong> <strong>City</strong> - urban council roads<br />
40%<br />
50<br />
% urban crashes on wet roads<br />
35%<br />
30%<br />
25%<br />
20%<br />
15%<br />
10%<br />
13<br />
27<br />
47<br />
38<br />
29<br />
48<br />
33<br />
38 33<br />
5%<br />
0%<br />
2000 2001 2002 2003 2004 2005 2006 2007 2008 2009<br />
Year<br />
Note: While the graph plots percentages, the number of crashes is shown against the <strong>data</strong> points.<br />
All <strong>NZ</strong> LR <strong>Invercargill</strong> LR Group B LR<br />
60%<br />
Figure 8.18 Wet road crashes<br />
<strong>Invercargill</strong> <strong>City</strong> - rural council roads<br />
% of rural crashes on wet roads<br />
50%<br />
40%<br />
30%<br />
20%<br />
8<br />
11<br />
4<br />
4<br />
9<br />
10<br />
8<br />
4<br />
4<br />
1<br />
10%<br />
0%<br />
2000 2001 2002 2003 2004 2005 2006 2007 2008 2009<br />
Year<br />
Note: While the graph plots percentages, the number of crashes is shown against the <strong>data</strong> points.<br />
All <strong>NZ</strong> LR <strong>Invercargill</strong> LR Group B LR<br />
83 Local <strong>Road</strong> Statistics


