

Road safety data - Invercargill City 2010 - NZ Transport Agency
Road safety data - Invercargill City 2010 - NZ Transport Agency
Road safety data - Invercargill City 2010 - NZ Transport Agency

You also want an ePaper? Increase the reach of your titles
YUMPU automatically turns print PDFs into web optimized ePapers that Google loves.
<strong>Invercargill</strong> <strong>City</strong> <strong>Road</strong> Safety Report 2005-2009<br />
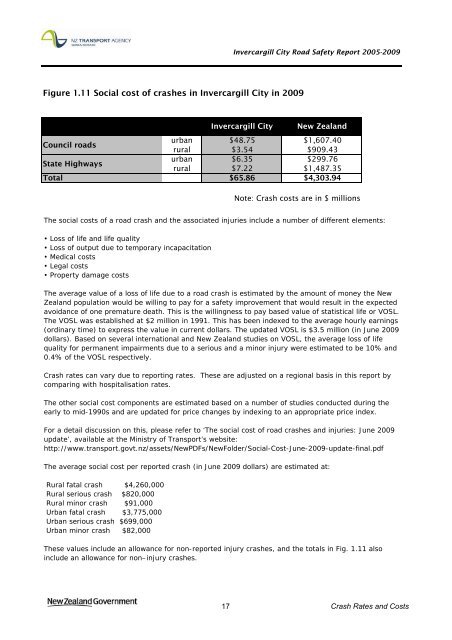
Figure 1.11 Social cost of crashes in <strong>Invercargill</strong> <strong>City</strong> in 2009<br />
<strong>Invercargill</strong> <strong>City</strong><br />
New Zealand<br />
Council roads<br />
State Highways<br />
Total<br />
urban<br />
rural<br />
urban<br />
rural<br />
$48.75<br />
$3.54<br />
$6.35<br />
$7.22<br />
$65.86<br />
$1,607.40<br />
$909.43<br />
$299.76<br />
$1,487.35<br />
$4,303.94<br />
Note: Crash costs are in $ millions<br />
The social costs of a road crash and the associated injuries include a number of different elements:<br />
• Loss of life and life quality<br />
• Loss of output due to temporary incapacitation<br />
• Medical costs<br />
• Legal costs<br />
• Property damage costs<br />
The average value of a loss of life due to a road crash is estimated by the amount of money the New<br />
Zealand population would be willing to pay for a <strong>safety</strong> improvement that would result in the expected<br />
avoidance of one premature death. This is the willingness to pay based value of statistical life or VOSL.<br />
The VOSL was established at $2 million in 1991. This has been indexed to the average hourly earnings<br />
(ordinary time) to express the value in current dollars. The updated VOSL is $3.5 million (in June 2009<br />
dollars). Based on several international and New Zealand studies on VOSL, the average loss of life<br />
quality for permanent impairments due to a serious and a minor injury were estimated to be 10% and<br />
0.4% of the VOSL respectively.<br />
Crash rates can vary due to reporting rates. These are adjusted on a regional basis in this report by<br />
comparing with hospitalisation rates.<br />
The other social cost components are estimated based on a number of studies conducted during the<br />
early to mid-1990s and are updated for price changes by indexing to an appropriate price index.<br />
For a detail discussion on this, please refer to ‘The social cost of road crashes and injuries: June 2009<br />
update’, available at the Ministry of <strong>Transport</strong>’s website:<br />
http://www.transport.govt.nz/assets/NewPDFs/NewFolder/Social-Cost-June-2009-update-final.pdf<br />
The average social cost per reported crash (in June 2009 dollars) are estimated at:<br />
Rural fatal crash $4,260,000<br />
Rural serious crash $820,000<br />
Rural minor crash $91,000<br />
Urban fatal crash $3,775,000<br />
Urban serious crash $699,000<br />
Urban minor crash $82,000<br />
These values include an allowance for non-reported injury crashes, and the totals in Fig. 1.11 also<br />
include an allowance for non–injury crashes.<br />
17 Crash Rates and Costs


