

Road safety data - Invercargill City 2010 - NZ Transport Agency
Road safety data - Invercargill City 2010 - NZ Transport Agency
Road safety data - Invercargill City 2010 - NZ Transport Agency

Create successful ePaper yourself
Turn your PDF publications into a flip-book with our unique Google optimized e-Paper software.
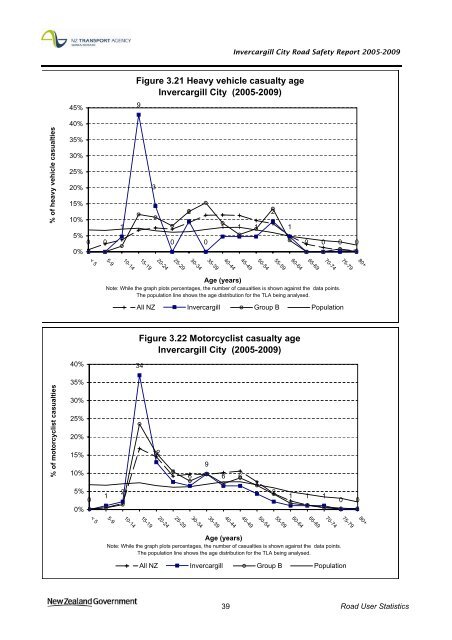
<strong>Invercargill</strong> <strong>City</strong> <strong>Road</strong> Safety Report 2005-2009<br />
45%<br />
Figure 3.21 Heavy vehicle casualty age<br />
<strong>Invercargill</strong> <strong>City</strong> (2005-2009)<br />
9<br />
40%<br />
% of heavy vehicle casualties<br />
35%<br />
30%<br />
25%<br />
20%<br />
15%<br />
10%<br />
5%<br />
0%<br />
0 0<br />
1<br />
3<br />
0<br />
2<br />
0<br />
1 1 1<br />
2<br />
1<br />
0 0 0 0<br />
< 5<br />
80+<br />
10-14<br />
20-24<br />
25-29<br />
30-34<br />
45-49<br />
5-9<br />
15-19<br />
35-39<br />
40-44<br />
50-54<br />
55-59<br />
60-64<br />
65-69<br />
70-74<br />
75-79<br />
Age (years)<br />
Note: While the graph plots percentages, the number of casualties is shown against the <strong>data</strong> points.<br />
The population line shows the age distribution for the TLA being analysed.<br />
All <strong>NZ</strong> <strong>Invercargill</strong> Group B Population<br />
Figure 3.22 Motorcyclist casualty age<br />
<strong>Invercargill</strong> <strong>City</strong> (2005-2009)<br />
40%<br />
34<br />
% of motorcyclist casualties<br />
35%<br />
30%<br />
25%<br />
20%<br />
15%<br />
10%<br />
5%<br />
0%<br />
0<br />
1<br />
2<br />
12<br />
7<br />
6<br />
9<br />
6 6<br />
4<br />
2<br />
1<br />
1<br />
1<br />
0 0<br />
< 5<br />
5-9<br />
10-14<br />
15-19<br />
20-24<br />
25-29<br />
30-34<br />
35-39<br />
40-44<br />
45-49<br />
50-54<br />
55-59<br />
60-64<br />
65-69<br />
70-74<br />
80+<br />
75-79<br />
Age (years)<br />
Note: While the graph plots percentages, the number of casualties is shown against the <strong>data</strong> points.<br />
The population line shows the age distribution for the TLA being analysed.<br />
All <strong>NZ</strong> <strong>Invercargill</strong> Group B Population<br />
39 <strong>Road</strong> User Statistics


