

Road safety data - Invercargill City 2010 - NZ Transport Agency
Road safety data - Invercargill City 2010 - NZ Transport Agency
Road safety data - Invercargill City 2010 - NZ Transport Agency

You also want an ePaper? Increase the reach of your titles
YUMPU automatically turns print PDFs into web optimized ePapers that Google loves.
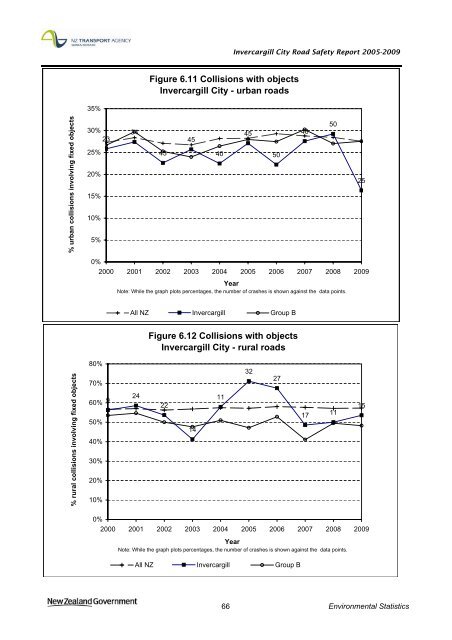
<strong>Invercargill</strong> <strong>City</strong> <strong>Road</strong> Safety Report 2005-2009<br />
Figure 6.11 Collisions with objects<br />
<strong>Invercargill</strong> <strong>City</strong> - urban roads<br />
35%<br />
% urban collisions involving fixed objects<br />
30%<br />
23<br />
25%<br />
20%<br />
15%<br />
10%<br />
5%<br />
34<br />
43<br />
45<br />
40<br />
45<br />
50<br />
48<br />
50<br />
25<br />
0%<br />
2000 2001 2002 2003 2004 2005 2006 2007 2008 2009<br />
Year<br />
Note: While the graph plots percentages, the number of crashes is shown against the <strong>data</strong> points.<br />
All <strong>NZ</strong> <strong>Invercargill</strong> Group B<br />
Figure 6.12 Collisions with objects<br />
<strong>Invercargill</strong> <strong>City</strong> - rural roads<br />
% rural collisions involving fixed objects<br />
80%<br />
70%<br />
60%<br />
50%<br />
40%<br />
30%<br />
20%<br />
10%<br />
9<br />
24<br />
22<br />
14<br />
11<br />
32<br />
27<br />
17<br />
11<br />
15<br />
0%<br />
2000 2001 2002 2003 2004 2005 2006 2007 2008 2009<br />
Year<br />
Note: While the graph plots percentages, the number of crashes is shown against the <strong>data</strong> points.<br />
All <strong>NZ</strong> <strong>Invercargill</strong> Group B<br />
66 Environmental Statistics


