

Road safety data - Invercargill City 2010 - NZ Transport Agency
Road safety data - Invercargill City 2010 - NZ Transport Agency
Road safety data - Invercargill City 2010 - NZ Transport Agency

Create successful ePaper yourself
Turn your PDF publications into a flip-book with our unique Google optimized e-Paper software.
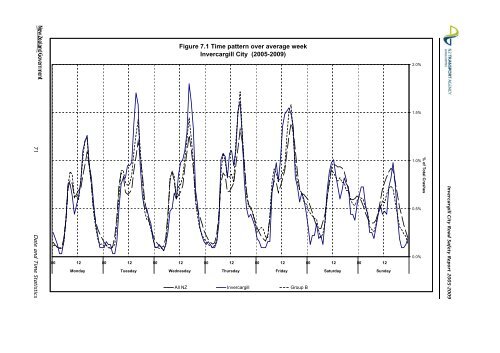
Figure 7.1 Time pattern over average week<br />
<strong>Invercargill</strong> <strong>City</strong> (2005-2009)<br />
2.0%<br />
1.5%<br />
71 Date and Time Statistics<br />
00 12 00 12 00 12 00 12 00 12 00 12 00 12<br />
Monday Tuesday Wednesday Thursday Friday Saturday Sunday<br />
All <strong>NZ</strong> <strong>Invercargill</strong> Group B<br />
1.0%<br />
0.5%<br />
0.0%<br />
% of Total Crashes<br />
<strong>Invercargill</strong> <strong>City</strong> <strong>Road</strong> Safety Report 2005-2009


