

Road safety data - Invercargill City 2010 - NZ Transport Agency
Road safety data - Invercargill City 2010 - NZ Transport Agency
Road safety data - Invercargill City 2010 - NZ Transport Agency

You also want an ePaper? Increase the reach of your titles
YUMPU automatically turns print PDFs into web optimized ePapers that Google loves.
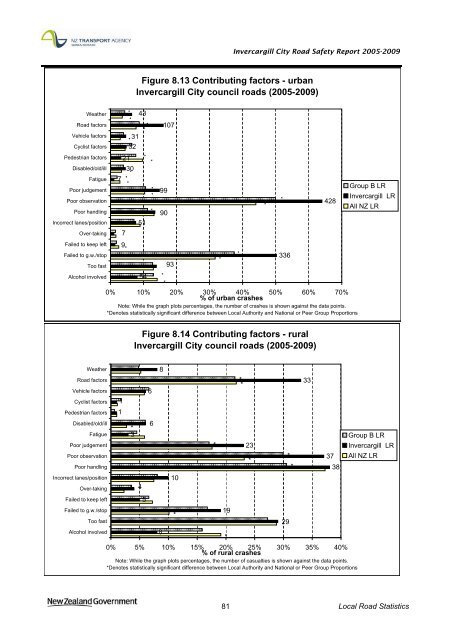
<strong>Invercargill</strong> <strong>City</strong> <strong>Road</strong> Safety Report 2005-2009<br />
Figure 8.13 Contributing factors - urban<br />
<strong>Invercargill</strong> <strong>City</strong> council roads (2005-2009)<br />
Weather<br />
*<br />
*<br />
43<br />
<strong>Road</strong> factors<br />
*<br />
*<br />
107<br />
Vehicle factors<br />
Cyclist factors<br />
31<br />
32<br />
*<br />
Pedestrian factors<br />
Disabled/old/ill<br />
Fatigue<br />
Poor judgement<br />
Poor observation<br />
Poor handling<br />
Incorrect lanes/position<br />
Over-taking<br />
7<br />
21<br />
30<br />
* *<br />
*<br />
7<br />
51<br />
*<br />
* * *<br />
*<br />
99<br />
90<br />
*<br />
*<br />
*<br />
428<br />
Group B LR<br />
<strong>Invercargill</strong> LR<br />
All <strong>NZ</strong> LR<br />
Failed to keep left<br />
Failed to g.w./stop<br />
Too fast<br />
9<br />
*<br />
93<br />
*<br />
*<br />
336<br />
Alcohol involved<br />
54<br />
*<br />
0% 10% 20% 30% 40% 50% 60% 70%<br />
% of urban crashes<br />
Note: While the graph plots percentages, the number of crashes is shown against the <strong>data</strong> points.<br />
*Denotes statistically significant difference between Local Authority and National or Peer Group Proportions<br />
Figure 8.14 Contributing factors - rural<br />
<strong>Invercargill</strong> <strong>City</strong> council roads (2005-2009)<br />
Weather<br />
<strong>Road</strong> factors<br />
Vehicle factors<br />
Cyclist factors<br />
Pedestrian factors<br />
1<br />
1<br />
6<br />
8<br />
* *<br />
33<br />
Disabled/old/ill<br />
Fatigue<br />
Poor judgement<br />
Poor observation<br />
Poor handling<br />
Incorrect lanes/position<br />
Over-taking<br />
*<br />
3<br />
4<br />
6<br />
10<br />
*<br />
23<br />
*<br />
*<br />
*<br />
37<br />
38<br />
Group B LR<br />
<strong>Invercargill</strong> LR<br />
All <strong>NZ</strong> LR<br />
Failed to keep left<br />
Failed to g.w./stop<br />
5<br />
*<br />
19<br />
Too fast<br />
Alcohol involved<br />
8<br />
*<br />
29<br />
0% 5% 10% 15% 20% 25% 30% 35% 40%<br />
% of rural crashes<br />
Note: While the graph plots percentages, the number of casualties is shown against the <strong>data</strong> points.<br />
*Denotes statistically significant difference between Local Authority and National or Peer Group Proportions<br />
81 Local <strong>Road</strong> Statistics


