

Road safety data - Invercargill City 2010 - NZ Transport Agency
Road safety data - Invercargill City 2010 - NZ Transport Agency
Road safety data - Invercargill City 2010 - NZ Transport Agency

You also want an ePaper? Increase the reach of your titles
YUMPU automatically turns print PDFs into web optimized ePapers that Google loves.
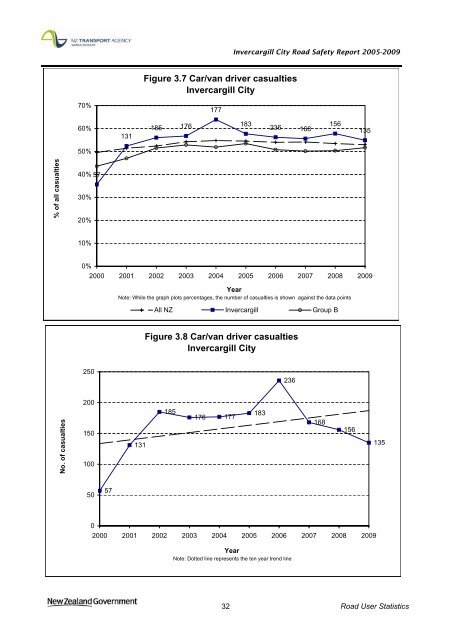
<strong>Invercargill</strong> <strong>City</strong> <strong>Road</strong> Safety Report 2005-2009<br />
Figure 3.7 Car/van driver casualties<br />
<strong>Invercargill</strong> <strong>City</strong><br />
70%<br />
177<br />
60%<br />
131<br />
185<br />
176<br />
183<br />
236<br />
168<br />
156<br />
135<br />
50%<br />
% of all casualties<br />
40% 57<br />
30%<br />
20%<br />
10%<br />
0%<br />
2000 2001 2002 2003 2004 2005 2006 2007 2008 2009<br />
Year<br />
Note: While the graph plots percentages, the number of casualties is shown against the <strong>data</strong> points<br />
All <strong>NZ</strong> <strong>Invercargill</strong> Group B<br />
Figure 3.8 Car/van driver casualties<br />
<strong>Invercargill</strong> <strong>City</strong><br />
250<br />
236<br />
200<br />
No. of casualties<br />
150<br />
100<br />
131<br />
185<br />
176 177<br />
183<br />
168<br />
156<br />
135<br />
50<br />
57<br />
0<br />
2000 2001 2002 2003 2004 2005 2006 2007 2008 2009<br />
Year<br />
Note: Dotted line represents the ten year trend line<br />
32 <strong>Road</strong> User Statistics


