CQUniversity Annual Report - Central Queensland University
CQUniversity Annual Report - Central Queensland University
CQUniversity Annual Report - Central Queensland University

Create successful ePaper yourself
Turn your PDF publications into a flip-book with our unique Google optimized e-Paper software.
<strong>CQ<strong>University</strong></strong> ANNUAL REPORT 2012<br />
OUR FINANCIAL PERFORMANCE<br />
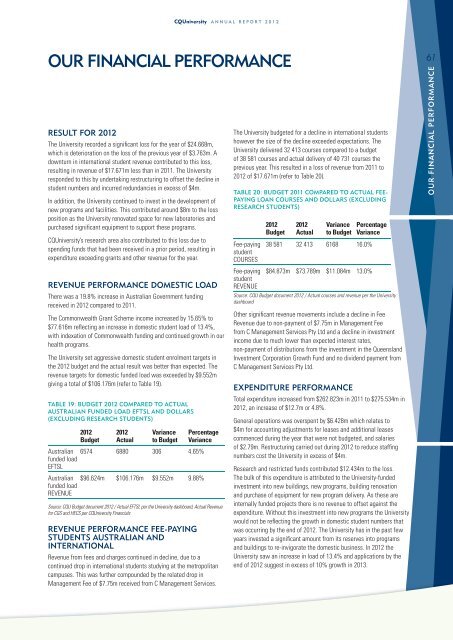
RESULT FOR 2012<br />
The <strong>University</strong> recorded a signifi cant loss for the year of $24.668m,<br />
which is deterioration on the loss of the previous year of $3.763m. A<br />
downturn in international student revenue contributed to this loss,<br />
resulting in revenue of $17.671m less than in 2011. The <strong>University</strong><br />
responded to this by undertaking restructuring to offset the decline in<br />
student numbers and incurred redundancies in excess of $4m.<br />
In addition, the <strong>University</strong> continued to invest in the development of<br />
new programs and facilities. This contributed around $8m to the loss<br />
position as the <strong>University</strong> renovated space for new laboratories and<br />
purchased significant equipment to support these programs.<br />
<strong>CQ<strong>University</strong></strong>’s research area also contributed to this loss due to<br />
spending funds that had been received in a prior period, resulting in<br />
expenditure exceeding grants and other revenue for the year.<br />
REVENUE PERFORMANCE DOMESTIC LOAD<br />
There was a 19.8% increase in Australian Government funding<br />
received in 2012 compared to 2011.<br />
The Commonwealth Grant Scheme income increased by 15.65% to<br />
$77.616m reflecting an increase in domestic student load of 13.4%,<br />
with indexation of Commonwealth funding and continued growth in our<br />
health programs.<br />
The <strong>University</strong> set aggressive domestic student enrolment targets in<br />
the 2012 budget and the actual result was better than expected. The<br />
revenue targets for domestic funded load was exceeded by $9.552m<br />
giving a total of $106.176m (refer to Table 19).<br />
TABLE 19: BUDGET 2012 COMPARED TO ACTUAL<br />
AUSTRALIAN FUNDED LOAD EFTSL AND DOLLARS<br />
(EXCLUDING RESEARCH STUDENTS)<br />
2012<br />
Budget<br />
2012<br />
Actual<br />
Variance<br />
to Budget<br />
Percentage<br />
Variance<br />
Australian 6574 6880 306 4.65%<br />
funded load<br />
EFTSL<br />
Australian $96.624m $106.176m $9.552m 9.88%<br />
funded load<br />
REVENUE<br />
Source: CQU Budget document 2012 / Actual EFTSL per the <strong>University</strong> dashboard, Actual Revenue<br />
for CGS and HECS per <strong>CQ<strong>University</strong></strong> Financials<br />
REVENUE PERFORMANCE FEE-PAYING<br />
STUDENTS AUSTRALIAN AND<br />
INTERNATIONAL<br />
Revenue from fees and charges continued in decline, due to a<br />
continued drop in international students studying at the metropolitan<br />
campuses. This was further compounded by the related drop in<br />
Management Fee of $7.75m received from C Management Services.<br />
The <strong>University</strong> budgeted for a decline in international students<br />
however the size of the decline exceeded expectations. The<br />
<strong>University</strong> delivered 32 413 courses compared to a budget<br />
of 38 581 courses and actual delivery of 40 731 courses the<br />
previous year. This resulted in a loss of revenue from 2011 to<br />
2012 of $17.671m (refer to Table 20).<br />
TABLE 20: BUDGET 2011 COMPARED TO ACTUAL FEE-<br />
PAYING LOAN COURSES AND DOLLARS (EXCLUDING<br />
RESEARCH STUDENTS)<br />
Fee-paying<br />
student<br />
COURSES<br />
Fee-paying<br />
student<br />
REVENUE<br />
2012<br />
Budget<br />
2012<br />
Actual<br />
Variance<br />
to Budget<br />
Percentage<br />
Variance<br />
38 581 32 413 6168 16.0%<br />
$84.873m $73.789m $11.084m 13.0%<br />
Source: CQU Budget document 2012 / Actual courses and revenue per the <strong>University</strong><br />
dashboard<br />
Other signifi cant revenue movements include a decline in Fee<br />
Revenue due to non-payment of $7.75m in Management Fee<br />
from C Management Services Pty Ltd and a decline in investment<br />
income due to much lower than expected interest rates,<br />
non-payment of distributions from the investment in the <strong>Queensland</strong><br />
Investment Corporation Growth Fund and no dividend payment from<br />
C Management Services Pty Ltd.<br />
EXPENDITURE PERFORMANCE<br />
Total expenditure increased from $262.823m in 2011 to $275.534m in<br />
2012, an increase of $12.7m or 4.8%.<br />
General operations was overspent by $6.428m which relates to<br />
$4m for accounting adjustments for leases and additional leases<br />
commenced during the year that were not budgeted, and salaries<br />
of $2.79m. Restructuring carried out during 2012 to reduce staffi ng<br />
numbers cost the <strong>University</strong> in excess of $4m.<br />
Research and restricted funds contributed $12.434m to the loss.<br />
The bulk of this expenditure is attributed to the <strong>University</strong>-funded<br />
investment into new buildings, new programs, building renovation<br />
and purchase of equipment for new program delivery. As these are<br />
internally funded projects there is no revenue to offset against the<br />
expenditure. Without this investment into new programs the <strong>University</strong><br />
would not be refl ecting the growth in domestic student numbers that<br />
was occurring by the end of 2012. The <strong>University</strong> has in the past few<br />
years invested a signifi cant amount from its reserves into programs<br />
and buildings to re-invigorate the domestic business. In 2012 the<br />
<strong>University</strong> saw an increase in load of 13.4% and applications by the<br />
end of 2012 suggest in excess of 10% growth in 2013.<br />
61<br />
OUR FINANCIAL PERFORMANCE