CQUniversity Annual Report - Central Queensland University
CQUniversity Annual Report - Central Queensland University
CQUniversity Annual Report - Central Queensland University

Create successful ePaper yourself
Turn your PDF publications into a flip-book with our unique Google optimized e-Paper software.
10<br />
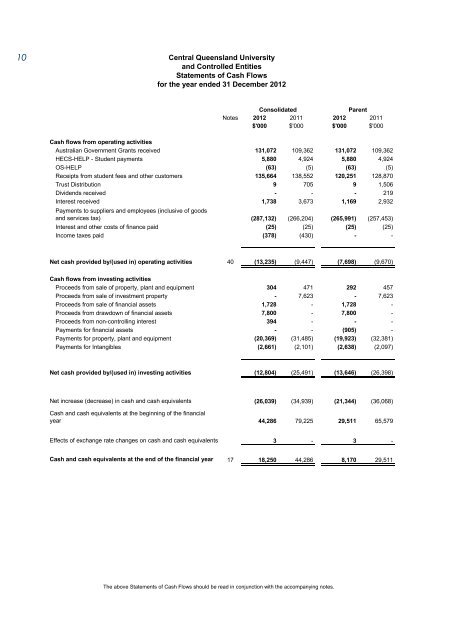
<strong>Central</strong> <strong>Queensland</strong> <strong>University</strong><br />
and Controlled Entities<br />
Statements of Cash Flows<br />
for the year ended 31 December 2012<br />
Consolidated<br />
Parent<br />
Notes 2012 2011 2012 2011<br />
$'000 $'000 $'000 $'000<br />
Cash flows from operating activities<br />
Australian Government Grants received 131,072 109,362 131,072 109,362<br />
HECS-HELP - Student payments 5,880 4,924 5,880 4,924<br />
OS-HELP (63) (5) (63) (5)<br />
Receipts from student fees and other customers 135,664 138,552 120,251 128,870<br />
Trust Distribution 9 705 9 1,506<br />
Dividends received - - - 219<br />
Interest received 1,738 3,673 1,169 2,932<br />
Payments to suppliers and employees (inclusive of goods<br />
and services tax) (287,132) (266,204) (265,991) (257,453)<br />
Interest and other costs of finance paid (25) (25) (25) (25)<br />
Income taxes paid (378) (430) - -<br />
Net cash provided by/(used in) operating activities 40 (13,235) (9,447) (7,698) (9,670)<br />
Cash flows from investing activities<br />
Proceeds from sale of property, plant and equipment 304 471 292 457<br />
Proceeds from sale of investment property - 7,623 - 7,623<br />
Proceeds from sale of financial assets 1,728 - 1,728 -<br />
Proceeds from drawdown of financial assets 7,800 - 7,800 -<br />
Proceeds from non-controlling interest 394 - - -<br />
Payments for financial assets - - (905) -<br />
Payments for property, plant and equipment (20,369) (31,485) (19,923) (32,381)<br />
Payments for Intangibles (2,661) (2,101) (2,638) (2,097)<br />
Net cash provided by/(used in) investing activities (12,804) (25,491) (13,646) (26,398)<br />
Net increase (decrease) in cash and cash equivalents (26,039) (34,939) (21,344) (36,068)<br />
Cash and cash equivalents at the beginning of the financial<br />
year 44,286 79,225 29,511 65,579<br />
Effects of exchange rate changes on cash and cash equivalents 3 - 3 -<br />
Cash and cash equivalents at the end of the financial year 17 18,250 44,286 8,170 29,511<br />
The above Statements of Cash Flows should be read in conjunction with the accompanying notes.