GEO Haiti 2010
GEO Haiti 2010
GEO Haiti 2010

Create successful ePaper yourself
Turn your PDF publications into a flip-book with our unique Google optimized e-Paper software.
<strong>GEO</strong> HAITI • <strong>2010</strong><br />
90<br />
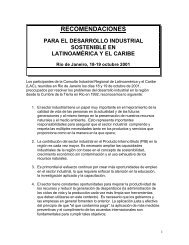
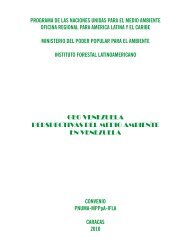
Figure 36: Water Pumping at the Cul-de-Sac Plain<br />
1.2.2 Drinking Water Supply<br />
Access to potable water has improved over<br />
the past 15 years. The percentage of the urban<br />
population with access to water has increased<br />
from 62% in 1990 to 70% in 2006. In the rural areas,<br />
there is less access and progress has been more<br />
modest, from 48% to 51% over the same period.<br />
However, this doesn’t mean that potable water is<br />
directly connected to homes. In urban areas, 21%<br />
of dwellings are connected to a network, while in<br />
rural areas, the percentage is only 4%. The graphs<br />
below show the evolution to drinking water in<br />
<strong>Haiti</strong>.<br />
Source: Courtesy of P. Basquiat<br />
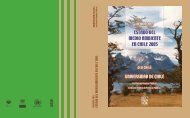
Figure 37: The Access of Urban Population to<br />
Drinking Water<br />
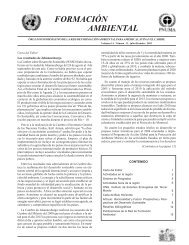
Figure 38: Access of rural population to drinking<br />
water<br />
Percentage of population<br />
100<br />
90<br />
80<br />
70<br />
60<br />
50<br />
40<br />
30<br />
20<br />
10<br />
0<br />
48<br />
2<br />
49<br />
Period<br />
Access to drinking water<br />
Connecting to a network<br />
Source: WHO / UNICEF (2008). Joint Monitoring Programme for Water<br />
Supply and Sanitation.<br />
Coverage Estimates Improved Drinking Water<br />
Although the country has registered an increase<br />
in access to potable water, particularly in urban<br />
areas, this still remains insufficient in relation to<br />
the demographic growth. The spatial distribution<br />
of access to fresh water is shown in Figure 38.<br />
50<br />
51<br />
3 3 4<br />
1990 1995 2000 2006<br />
Percentage of population<br />
100<br />
90<br />
80<br />
70<br />
60<br />
50<br />
40<br />
30<br />
20<br />
10<br />
0<br />
Access to drinking water<br />
Connecting to a network<br />
67<br />
70<br />
62 65<br />
27 25<br />
24 21<br />
1990 1995 2000 2006<br />
Period<br />
Source: WHO / UNICEF (2008). Joint Monitoring Programme for Water<br />
Supply and Sanitation.<br />
Coverage Estimates Improved Drinking Water