

2012 Integrated report - Sappi
2012 Integrated report - Sappi
2012 Integrated report - Sappi

Create successful ePaper yourself
Turn your PDF publications into a flip-book with our unique Google optimized e-Paper software.
Sustainability continued<br />
Our key sustainability drivers continued<br />
Management of biodiversity takes place in terms of internationally<br />
accepted, independently verified forest certification systems<br />
PEFC, SFI ® and FSC, all of which make provision for effective<br />
biodiversity management. For example, Principle 6 of the FSC’s<br />
‘Principles and Criteria’, states: “Forest management shall<br />
conserve biological diversity and its associated values, water<br />
resources, soils, and unique and fragile ecosystems and<br />
landscapes, and, by so doing, maintain the ecological functions<br />
and the integrity of the forest”. PEFC certification is dependent<br />
on forest biodiversity being “maintained or enhanced”, while the<br />
SFI ® guidelines stipulate the protection of biodiversity.<br />
In the year under review, <strong>Sappi</strong> Forests undertook an analysis<br />
of the supply of ecosystems services from their landholdings<br />
and the importance of these to stakeholders.<br />
This is described in the expanded ‘Key sustainability<br />
drivers’ section of our group sustainability <strong>report</strong>, available<br />
at www.sappi.com.<br />
Energy<br />
As pulp and paper production is an energy-intensive process,<br />
the cost and availability of energy are key considerations for<br />
<strong>Sappi</strong>. Energy costs currently account for just under 11% of<br />
cost of sales. We mitigate this risk by focusing on reducing<br />
specific purchased energy, improving the energy efficiency<br />
of our mills, increasing our use of renewable energy and selling<br />
surplus electricity.<br />
Renewable energy<br />
We have a major advantage over other industrial companies in<br />
that globally, 50.3% of our energy is derived from renewable<br />
sources, namely: black liquor – a by-product of the pulping<br />
process, sludges (in North America and Europe) and biomass.<br />
Sales of power<br />
Many of our mills have excess power which we sell on to<br />
third-party customers. In FY<strong>2012</strong>, in Europe we sold<br />
554,100MWh (1,994,700GJ) and in North America 130,230MWh<br />
(468,800GJ). In South Africa, the state power utility Eskom has<br />
established a scheme that allows independent power producers<br />
to supply power to the grid at levels higher than they would<br />
be charged for power. In South Africa, in FY<strong>2012</strong> we sold<br />
32,200MWh (115,941GJ) to Eskom, from Ngodwana Mill.<br />
Emissions – regulatory developments<br />
Our extensive use of renewable energy results in a high degree<br />
of energy self-sufficiency and lower levels of greenhouse gas<br />
emissions from fossil fuels. We believe that emissions from<br />
renewable energy should not be subject to carbon tax.<br />
Europe<br />
Carbon taxes<br />
The carbon tax proposal formulated by the European<br />
Commission in 2010 has yet to be agreed to by the 27 member<br />
states. The current proposal by the European Commission<br />
would charge firms between €4 and €30 per ton of CO 2 .<br />
Several European countries have enacted national carbon<br />
taxes including Denmark, Finland, Ireland, the Netherlands,<br />
Norway, Slovenia, Sweden, Switzerland and the UK.<br />
EU ETS<br />
Launched in 2005, the European Union Emissions Trading<br />
Scheme (EU ETS) works on the ‘cap and trade’ principle.<br />
The scheme now covers the 27 countries of the European<br />
Union, and three non-European Union members.<br />
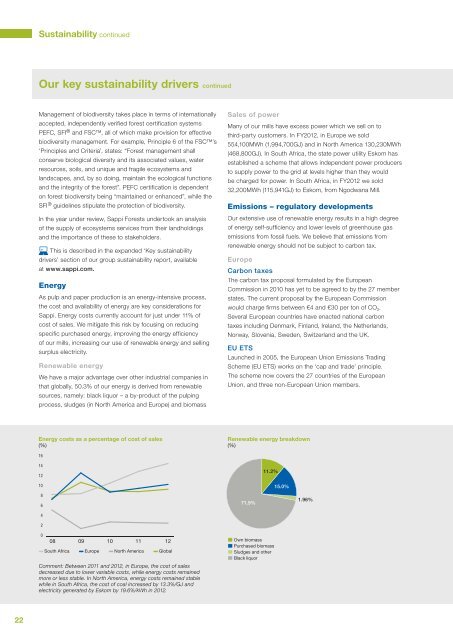
Energy costs as a percentage of cost of sales<br />
(%)<br />
Renewable energy breakdown<br />
(%)<br />
16<br />
14<br />
12<br />
10<br />
8<br />
6<br />
4<br />
2<br />
71.9%<br />
11.2%<br />
15.0%<br />
1.96%<br />
0<br />
08 09 10 11 12<br />
– South Africa – Europe – North America – Global<br />
Comment: Between 2011 and <strong>2012</strong>, in Europe, the cost of sales<br />
decreased due to lower variable costs, while energy costs remained<br />
more or less stable. In North America, energy costs remained stable<br />
while in South Africa, the cost of coal increased by 13.3%/GJ and<br />
electricity generated by Eskom by 19.6%/kWh in <strong>2012</strong>.<br />
Own biomass<br />
Purchased biomass<br />
Sludges and other<br />
Black liquor<br />
22


