Boxoffice-January.08.1955
You also want an ePaper? Increase the reach of your titles
YUMPU automatically turns print PDFs into web optimized ePapers that Google loves.
; fell<br />
, in<br />
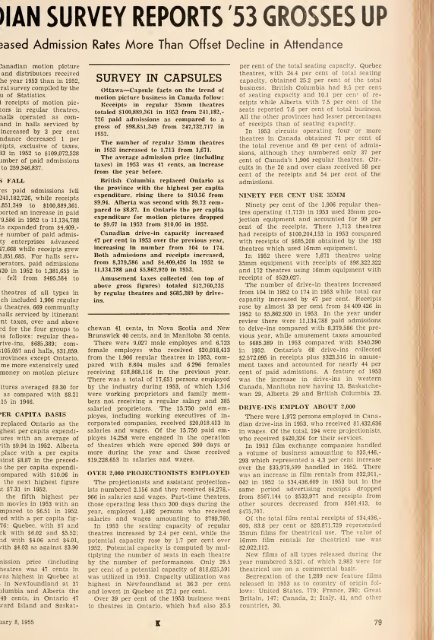
)IAN SURVEY REPORTS '53 GROSSES UP<br />
jased Admission Rates More Than Offset Decline in<br />
Attendance<br />
Canadian motion picture<br />
and distributors received<br />
he year 1953 tlian in 1952,<br />
ral survey compiled by the<br />
u of Statistics.<br />
1 receipts of motion pietors<br />
in regular theatres,<br />
tialls operated as comand<br />
in halls serviced by<br />
increased by 3 per cent<br />
ndance decreased 1 per<br />
eipts, exclusive of taxes,<br />
83 in 1952 to $109,072,528<br />
jmber of paid admissions<br />
to 259,346,837.<br />
S<br />
FALL<br />
"es paid admissions fell<br />
241.182,726, while receipts<br />
,851,349 to $100,889,361.<br />
jorted an increase in paid<br />
'9,586 in 1952 to 11,134,788<br />
ts expanded from $4,409,-<br />
e number of paid admisty<br />
enterprises advanced<br />
47,668 while receipts grew<br />
1.851.685. For halls servierators,<br />
paid admissions<br />
120 in 1952 to 1,381,655 in<br />
from $495,584 to<br />
theatres of all types in<br />
ch included 1,906 regular<br />
1 theatres, 669 community<br />
lalls serviced by itinerant<br />
nt taxes, over and above<br />
;d for the four groups to<br />
as follows: regular thearive-ins,<br />
$685,389: com-<br />
;105,057 and halls, $31,859.<br />
provinces except Ontario,<br />
me more extensively used<br />
money on motion picture<br />
itures averaged $8.30 for<br />
as compared with $8.21<br />
.15 in 1946.<br />
'ER CAPITA BASIS<br />
replaced Ontario as the<br />
ghest per capita expendiures<br />
with an average of<br />
ith $9.94 in 1952. Alberta<br />
place with a per capita<br />
iinst $8.87 in the preced-<br />
) the per capita expendi-<br />
:ompared with $10.06 in<br />
the next highest figure<br />
;t $7.31 in 1952.<br />
the fifth highest per<br />
n movies in 1953 with an<br />
mpared to $6.51 in 1952.<br />
ed with a per capita fig-<br />
76: Quebec, with $7 and<br />
ck with $6.02 and $5.52:<br />
nd with $4.06 and $4.01,<br />
nth $4,03 as against $3.90<br />
nission price (including<br />
heatres was 47 cents in<br />
las highest in Quebec at<br />
Newfoundland at 37<br />
Dlumbia and Alberta the<br />
49 cents, in Ontario 47<br />
^•ard Island and Saskat-<br />
SURVEY IN CAPSULES<br />
Ottawa—Capsule facts on the trend of<br />
motion picture business in Canada follow:<br />
Receipts in regular 35mni theatres<br />
totaled $100,889,361 in 1953 from 241,182.-<br />
726 paid admissions as compared to a<br />
grross of $98,851,349 from 247,732,717 in<br />
1952.<br />
The number of<br />
regular 35mm theatres<br />
in 1953 increased to 1,713 from 1,671.<br />
The average admission price (including<br />
taxes) in 1953 was 47 cents, an increase<br />
from the year before.<br />
British Columbia replaced Ontario as<br />
the province with the highest per capita<br />
expenditure, rising there to $10.56 from<br />
$9.94. Alberta was second with $9.73 compared<br />
to S8.87. In Ontario the per capita<br />
expenditure for motion pictures dropped<br />
to $9.67 In 1953 from $10.06 in 1952.<br />
Canadian drive-in capacity increased<br />
47 per cent in 1953 over the previous year,<br />
increasing in number from 104 to 174.<br />
Both admissions and receipts increased,<br />
from 8,379,586 and $4,409,426 in 1952 to<br />
11,134,788 and $5,862,920 in 1953.<br />
Amusement taxes collected (on top of<br />
above gross figures) totaled $12,760,235<br />
by regular theatres and $685,389 by driveins.<br />
chewan 41 cents, in Nova Scotia and New<br />
Brunswick 40 cents, and in Manitoba 38 cents.<br />
There were 9,027 male employes and 6,723<br />
female employes who received $20,018,413<br />
from the 1.906 regular theatres in 1953, compared<br />
with 8.804 males and 6296 females<br />
receiving $18,868,116 in the previous year.<br />
There was a total of 17,651 persons employed<br />
by the industry during 1953. of which 1,516<br />
were working proprietors and family members<br />
not receiving a regular salary and 385<br />
salaried proprietors. The 15.750 paid employes,<br />
including working executives of incorporated<br />
companies, received $20,018,413 in<br />
salaries and wages. Of the 15.750 paid employes<br />
14.258 were engaged in the operation<br />
of theatres which were opened 300 days or<br />
more during the year and these received<br />
$19,228,653 in salaries and wages.<br />
OVER 2,000 PROJECTIONISTS EMPLOTED<br />
The projectionists and assistant projectionists<br />
numbered 2.156 and they received $6,278.-<br />
966 in salaries and wages. Part-time theatres,<br />
those operating less than 300 days during the<br />
year, employed 1.492 persons who received<br />
salaries and wages amounting to $789,760.<br />
In 1953 the seating capacity of regular<br />
theatres increased by 2.4 per cent, while the<br />
potential capacity rose by 1.7 per cert over<br />
1952. Potential capacity is computed by multiplying<br />
the number of seats in each theatre<br />
by the number of performances. Only 29.5<br />
per cent of a potential capacity of 818.625,591<br />
was utilized in 1953. Capacity utilization was<br />
highest in Newfoundland at 36.3 per cent<br />
and lowest in Quebec at 27.1 per cent.<br />
Over 39 per cent of the 1953 business went<br />
to theatres in Ontario, which had also 35.5<br />
per cent of the total seating capacity. Quebec<br />
theatres, with 24.4 per cent of total seating<br />
capacity, obtained 25.2 per cent of the total<br />
business. British Columbia had 9.5 per cent<br />
of seating capacity and 10.1 per cen' of receipts<br />
while Alberta with 7.5 per cent of the<br />
seats reported 7.6 per cent of total business.<br />
All the other provinces had lesser percentages<br />
of receipts than of seating capacity.<br />
In 1953 circuits operating four or more<br />
theatres in Canada obtained 71 per cent of<br />
the total revenue and 69 per cent of admissions,<br />
although they numbered only 37 per<br />
cent of Canada's 1.906 regular theatres. Circuits<br />
in the 20 and over class received 58 per<br />
cent of the receipts and 54 per cent of the<br />
admissions.<br />
NINETY PER CENT USE 35MM<br />
Ninety per cent of the 1,906 regular theatres<br />
operating (1.713) in 1953 used 35mm projection<br />
equipment and accounted for 99 per<br />
cent of the receipts. These 1.713 theatres<br />
had receipts of $100,204,153 in 1953 compared<br />
with receipts of $685,208 obtained by the 193<br />
theatres which used 16mm equipment.<br />
In 1952 there were 1.671 theatres using<br />
35mm equipment with receipts of $98,322,322<br />
and 172 theatres using 16mm equipment with<br />
receipts of $529,027.<br />
The number of drive-in theatres increased<br />
from 104 in 1952 to 174 in 1953 while total car<br />
capacity increased by 47 per cent. Receipts<br />
rose by almost 33 per cent from $4 409,426 in<br />
1952 to $5,862,920 in 1953. In the year under<br />
review there were 11.134.788 paid admissions<br />
to drive-ins compared with 8.379,586 the previous<br />
year, while amusement taxes amounted<br />
to $685,389 in 1953 compared with $540,390<br />
ia 1952. Ontario's 68 drive-ins collected<br />
$2 572.095 in receipts plus $323,516 in amusement<br />
taxes and accounted for nearly 44 per<br />
cent of paid admissions. A feature of 1953<br />
was the increase in drive-ins in western<br />
Canada, Manitoba now having 13. Saskatchewan<br />
29, Alberta 29 and British Columbia 23.<br />
DRIVE-INS EMPLOY ABOUT 2,000<br />
There were 1,972 persons employed in Canadian<br />
drive-ins in 1953, who received $1,432,636<br />
in wages. Of the total, 194 were projectionists,<br />
who received $420,326 for their services.<br />
In 1953 film exchange companies handled<br />
a volume of business amounting to $35,446,-<br />
293 which represented a 4.3 per cent increase<br />
over the $33,979,599 handled in 1952. There<br />
was an increase in film rentals from $32,911.-<br />
042 in 1952 to $34,436,609 in 1953 but In the<br />
same period advertising receipts dropped<br />
from $567,144 to $533,977 and receipts from<br />
other sources decreased from $501,413. to<br />
$475,707.<br />
Of the total film rental receipts of $34,436,-<br />
609. 83.8 per cent or $28,871,729 represented<br />
35mm films for theatrical use. The value of<br />
16mm film rentals for theatrical use was<br />
$2,022,112.<br />
New films of all types released during the<br />
year numbered 3.521. of which 2.983 were for<br />
theatrical use on a commercial basis.<br />
Segregation of the 1.289 new feature films<br />
released in 1953 as to country of origin follows:<br />
United States. 779: France. 290: Great<br />
Britain. 147: Canada, 2; Italy. 41. and other<br />
countries, 30.<br />
lary 8, 1955 79


