- Page 1:
Erzsébet Csuhaj-Varjú Marian Gheo
- Page 4 and 5:
Editors Erzsébet Csuhaj-Varjú Dep
- Page 6 and 7:
Preface In addition to the texts or
- Page 8 and 9:
Contents M.A. Martínez-del-Amor, I
- Page 11 and 12:
13th Inter
- Page 13 and 14:
(Tissue) P systems with decaying ob
- Page 15 and 16:
(Tissue) P systems with decaying ob
- Page 17 and 18:
(Tissue) P systems with decaying ob
- Page 19 and 20:
(Tissue) P systems with decaying ob
- Page 21 and 22:
(Tissue) P systems with decaying ob
- Page 23 and 24:
(Tissue) P systems with decaying ob
- Page 25 and 26:
(Tissue) P systems with decaying ob
- Page 27 and 28:
(Tissue) P systems with decaying ob
- Page 29 and 30:
(Tissue) P systems with decaying ob
- Page 31 and 32:
(Tissue) P systems with decaying ob
- Page 33 and 34:
(Tissue) P systems with decaying ob
- Page 35:
(Tissue) P systems with decaying ob
- Page 38 and 39:
Sorin Istrail, Solomon Marcus of pr
- Page 40 and 41:
Sorin Istrail, Solomon Marcus proba
- Page 42 and 43:
Sorin Istrail, Solomon Marcus stati
- Page 44 and 45:
Sorin Istrail, Solomon Marcus 4.
- Page 46 and 47:
Sorin Istrail, Solomon Marcus his f
- Page 49 and 50:
13th Inter
- Page 51 and 52:
Turing’s three pioneering initiat
- Page 53 and 54:
Turing’s three pioneering initiat
- Page 55 and 56:
13th Inter
- Page 57:
MP systems for systems biology tere
- Page 60 and 61:
Yu. Rogozhin this obstacle and to g
- Page 62 and 63:
Yu. Rogozhin 10. J. Cocke, M. Minsk
- Page 64 and 65:
M. Stannett The question arises, wh
- Page 67:
Regular Contributions
- Page 70 and 71:
T. Ahmed, G. DeLancy, A. Paun almos
- Page 72 and 73:
T. Ahmed, G. DeLancy, A. Paun purpo
- Page 74 and 75:
T. Ahmed, G. DeLancy, A. Paun Fig.
- Page 76 and 77:
T. Ahmed, G. DeLancy, A. Paun gener
- Page 78 and 79:
T. Ahmed, G. DeLancy, A. Paun
- Page 80 and 81:
T. Ahmed, G. DeLancy, A. Paun Table
- Page 82 and 83:
T. Ahmed, G. DeLancy, A. Paun 14. H
- Page 84 and 85:
T. Ahmed, G. DeLancy, A. Paun 84
- Page 87 and 88:
13th Inter
- Page 89 and 90:
Asynchronuous and maximally paralle
- Page 91 and 92:
Asynchronuous and maximally paralle
- Page 93 and 94:
Asynchronuous and maximally paralle
- Page 95 and 96:
Asynchronuous and maximally paralle
- Page 97:
Asynchronuous and maximally paralle
- Page 100 and 101:
A. Alhazov, R. Freund, H. Heikenwä
- Page 102 and 103:
A. Alhazov, R. Freund, H. Heikenwä
- Page 104 and 105:
A. Alhazov, R. Freund, H. Heikenwä
- Page 106 and 107:
A. Alhazov, R. Freund, H. Heikenwä
- Page 108 and 109:
A. Alhazov, R. Freund, H. Heikenwä
- Page 110 and 111:
A. Alhazov, R. Freund, H. Heikenwä
- Page 112 and 113:
A. Alhazov, R. Freund, H. Heikenwä
- Page 114 and 115:
A. Alhazov, R. Freund, H. Heikenwä
- Page 116 and 117:
A. Alhazov, Yu. Rogozhin With coope
- Page 118 and 119:
A. Alhazov, Yu. Rogozhin 2.3 P Syst
- Page 120 and 121:
A. Alhazov, Yu. Rogozhin Such a sys
- Page 122 and 123:
A. Alhazov, Yu. Rogozhin applied, f
- Page 124 and 125:
A. Alhazov, Yu. Rogozhin - one extr
- Page 126 and 127:
B. Aman, G. Ciobanu formalisms is e
- Page 128 and 129:
B. Aman, G. Ciobanu membranes appea
- Page 130 and 131:
B. Aman, G. Ciobanu • [ ] recep r
- Page 132 and 133:
B. Aman, G. Ciobanu Definition 3. A
- Page 134 and 135:
B. Aman, G. Ciobanu { w i , for all
- Page 136 and 137:
B. Aman, G. Ciobanu The four transi
- Page 138 and 139:
B. Aman, G. Ciobanu A state space i
- Page 140 and 141:
B. Aman, G. Ciobanu to reiterate th
- Page 143 and 144:
13th Inter
- Page 145 and 146:
On structures and behaviors of spik
- Page 147 and 148:
On structures and behaviors of spik
- Page 149 and 150:
On structures and behaviors of spik
- Page 151 and 152:
On structures and behaviors of spik
- Page 153 and 154:
On structures and behaviors of spik
- Page 155 and 156:
On structures and behaviors of spik
- Page 157 and 158:
On structures and behaviors of spik
- Page 159:
On structures and behaviors of spik
- Page 162 and 163:
L. Cienciala, L. Ciencialová, M. P
- Page 164 and 165:
L. Cienciala, L. Ciencialová, M. P
- Page 166 and 167:
L. Cienciala, L. Ciencialová, M. P
- Page 168 and 169:
L. Cienciala, L. Ciencialová, M. P
- Page 170 and 171:
L. Cienciala, L. Ciencialová, M. P
- Page 172 and 173:
H. ElGindy, R. Nicolescu, H. Wu pat
- Page 174 and 175:
H. ElGindy, R. Nicolescu, H. Wu pro
- Page 176 and 177:
H. ElGindy, R. Nicolescu, H. Wu (b)
- Page 178 and 179:
H. ElGindy, R. Nicolescu, H. Wu 8 r
- Page 180 and 181:
H. ElGindy, R. Nicolescu, H. Wu Pse
- Page 182 and 183:
H. ElGindy, R. Nicolescu, H. Wu to
- Page 184 and 185:
H. ElGindy, R. Nicolescu, H. Wu ter
- Page 186 and 187:
H. ElGindy, R. Nicolescu, H. Wu 4.
- Page 188 and 189:
H. ElGindy, R. Nicolescu, H. Wu Tab
- Page 190 and 191:
H. ElGindy, R. Nicolescu, H. Wu 4.
- Page 192 and 193:
H. ElGindy, R. Nicolescu, H. Wu 6 R
- Page 194 and 195:
H. ElGindy, R. Nicolescu, H. Wu (wh
- Page 196 and 197:
H. ElGindy, R. Nicolescu, H. Wu 12.
- Page 199 and 200:
13th Inter
- Page 201 and 202:
A formal framework for P systems wi
- Page 203 and 204:
A formal framework for P systems wi
- Page 205 and 206:
A formal framework for P systems wi
- Page 207 and 208:
A formal framework for P systems wi
- Page 209 and 210:
A formal framework for P systems wi
- Page 211 and 212:
13th Inter
- Page 213 and 214:
A new approach for solving SAT by P
- Page 215 and 216:
A new approach for solving SAT by P
- Page 217 and 218:
A new approach for solving SAT by P
- Page 219 and 220:
A new approach for solving SAT by P
- Page 221 and 222:
13th Inter
- Page 223 and 224:
Maintenance of chronobiological inf
- Page 225 and 226:
Maintenance of chronobiological inf
- Page 227 and 228:
Maintenance of chronobiological inf
- Page 229 and 230:
Maintenance of chronobiological inf
- Page 231 and 232:
4 3.5 3 2.5 2 1.5 1 0.5 0 0 50 100
- Page 233 and 234:
Maintenance of chronobiological inf
- Page 235 and 236:
Maintenance of chronobiological inf
- Page 237 and 238:
Maintenance of chronobiological inf
- Page 239 and 240:
Maintenance of chronobiological inf
- Page 241 and 242:
Maintenance of chronobiological inf
- Page 243 and 244:
13th Inter
- Page 245 and 246:
Using a kernel P system to solve th
- Page 247 and 248:
Using a kernel P system to solve th
- Page 249 and 250:
Using a kernel P system to solve th
- Page 251 and 252:
Using a kernel P system to solve th
- Page 253 and 254:
Using a kernel P system to solve th
- Page 255 and 256:
Using a kernel P system to solve th
- Page 257 and 258:
Using a kernel P system to solve th
- Page 259 and 260:
13th Inter
- Page 261 and 262:
Spiking neural P systems with funct
- Page 263 and 264:
Spiking neural P systems with funct
- Page 265 and 266:
Spiking neural P systems with funct
- Page 267 and 268:
Spiking neural P systems with funct
- Page 269 and 270:
Spiking neural P systems with funct
- Page 271 and 272:
Spiking neural P systems with funct
- Page 273 and 274:
Spiking neural P systems with funct
- Page 275:
Spiking neural P systems with funct
- Page 278 and 279:
L.F. Macías-Ramos, M.J. Pérez-Jim
- Page 280 and 281:
L.F. Macías-Ramos, M.J. Pérez-Jim
- Page 282 and 283:
L.F. Macías-Ramos, M.J. Pérez-Jim
- Page 284 and 285:
L.F. Macías-Ramos, M.J. Pérez-Jim
- Page 286 and 287:
L.F. Macías-Ramos, M.J. Pérez-Jim
- Page 288 and 289:
L.F. Macías-Ramos, M.J. Pérez-Jim
- Page 290 and 291:
L.F. Macías-Ramos, M.J. Pérez-Jim
- Page 292 and 293:
M.A. Martínez-del-Amor, I. Pérez-
- Page 294 and 295:
M.A. Martínez-del-Amor, I. Pérez-
- Page 296 and 297:
M.A. Martínez-del-Amor, I. Pérez-
- Page 298 and 299:
M.A. Martínez-del-Amor, I. Pérez-
- Page 300 and 301:
M.A. Martínez-del-Amor, I. Pérez-
- Page 302 and 303:
M.A. Martínez-del-Amor, I. Pérez-
- Page 304 and 305:
M.A. Martínez-del-Amor, I. Pérez-
- Page 306 and 307:
M.A. Martínez-del-Amor, I. Pérez-
- Page 308 and 309:
M.A. Martínez-del-Amor, I. Pérez-
- Page 311 and 312:
13th Inter
- Page 313 and 314:
Membranes with local environments A
- Page 315 and 316:
Membranes with local environments T
- Page 317 and 318:
Membranes with local environments -
- Page 319 and 320:
Membranes with local environments -
- Page 321 and 322:
Membranes with local environments I
- Page 323 and 324:
13th Inter
- Page 325 and 326:
On efficient algorithms for SAT dis
- Page 327 and 328:
On efficient algorithms for SAT 2 S
- Page 329 and 330:
On efficient algorithms for SAT 2.4
- Page 331 and 332:
On efficient algorithms for SAT inc
- Page 333 and 334:
On efficient algorithms for SAT •
- Page 335 and 336:
On efficient algorithms for SAT Not
- Page 337 and 338:
On efficient algorithms for SAT the
- Page 339:
On efficient algorithms for SAT 32.
- Page 342 and 343:
A. Obtu̷lowicz - its underlying tr
- Page 344 and 345:
A. Obtu̷lowicz 2−ramification
- Page 346 and 347:
A. Obtu̷lowicz The correctness of
- Page 348 and 349: A. Obtu̷lowicz The arcs (links) fr
- Page 351 and 352: 13th Inter
- Page 353 and 354: An analysis of correlative and quan
- Page 355 and 356: An analysis of correlative and quan
- Page 357 and 358: An analysis of correlative and quan
- Page 359 and 360: An analysis of correlative and quan
- Page 361 and 362: An analysis of correlative and quan
- Page 363 and 364: An analysis of correlative and quan
- Page 365 and 366: An analysis of correlative and quan
- Page 367 and 368: An analysis of correlative and quan
- Page 369 and 370: 13th Inter
- Page 371 and 372: Sublinear-space P systems with acti
- Page 373 and 374: Sublinear-space P systems with acti
- Page 375 and 376: Sublinear-space P systems with acti
- Page 377 and 378: Sublinear-space P systems with acti
- Page 379 and 380: Sublinear-space P systems with acti
- Page 381 and 382: Sublinear-space P systems with acti
- Page 383 and 384: Sublinear-space P systems with acti
- Page 385 and 386: 13th Inter
- Page 387 and 388: Modelling ecological systems with t
- Page 389 and 390: Modelling ecological systems with t
- Page 391 and 392: Modelling ecological systems with t
- Page 393 and 394: Modelling ecological systems with t
- Page 395 and 396: Modelling ecological systems with t
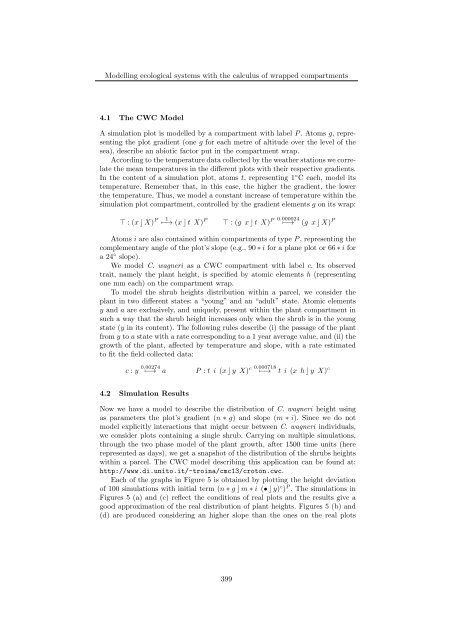
- Page 397: Modelling ecological systems with t
- Page 401 and 402: Modelling ecological systems with t
- Page 403 and 404: Modelling ecological systems with t
- Page 405: Modelling ecological systems with t
- Page 408 and 409: D. Sburlan hence one can gather use
- Page 410 and 411: D. Sburlan represents a 0L system.
- Page 412 and 413: D. Sburlan assuming that M is in a
- Page 414 and 415: D. Sburlan q 1 {t−, T 1 ↓, T 2
- Page 416 and 417: D. Sburlan In case of M, the states
- Page 418 and 419: D. Sburlan We introduced a formal s
- Page 420 and 421: P. Sosík [9, 10], several research
- Page 422 and 423: P. Sosík The rules of a system lik
- Page 424 and 425: P. Sosík 1. The family Π is polyn
- Page 426 and 427: P. Sosík (a) subsequently and recu
- Page 428 and 429: P. Sosík contentFinal = content(l,
- Page 430 and 431: P. Sosík Hence, with the aid of th
- Page 432 and 433: P. Sosík 8. Lakshmanan K. and Rama
- Page 434 and 435: S. Verlan, J. Quiros more relevance
- Page 436 and 437: S. Verlan, J. Quiros For a regular
- Page 438 and 439: S. Verlan, J. Quiros digital FPGA c
- Page 440 and 441: S. Verlan, J. Quiros where k j = N
- Page 442 and 443: S. Verlan, J. Quiros Now let us con
- Page 444 and 445: S. Verlan, J. Quiros We consider a
- Page 446 and 447: S. Verlan, J. Quiros the present co
- Page 448 and 449:
S. Verlan, J. Quiros Table 2 gives
- Page 450 and 451:
S. Verlan, J. Quiros Using similar
- Page 452 and 453:
S. Verlan, J. Quiros 5. M. Maliţa,
- Page 455 and 456:
13th Inter
- Page 457 and 458:
Simplifying Event-B models of P sys
- Page 461:
Author Index Adorna H., 143 Agrigor