Using Polymer Modified Asphalt Emulsions in Surface Treatments A ...
Using Polymer Modified Asphalt Emulsions in Surface Treatments A ...
Using Polymer Modified Asphalt Emulsions in Surface Treatments A ...
Create successful ePaper yourself
Turn your PDF publications into a flip-book with our unique Google optimized e-Paper software.
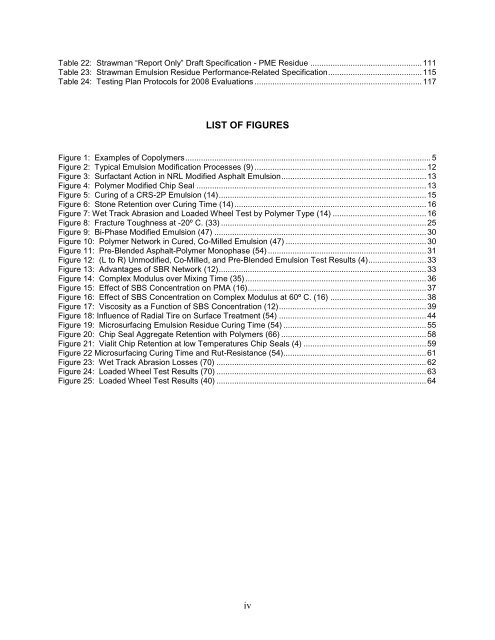
Table 22: Strawman “Report Only” Draft Specification - PME Residue .................................................. 111<br />
Table 23: Strawman Emulsion Residue Performance-Related Specification .......................................... 115<br />
Table 24: Test<strong>in</strong>g Plan Protocols for 2008 Evaluations ........................................................................... 117<br />
LIST OF FIGURES<br />
Figure 1: Examples of Copolymers .............................................................................................................. 5<br />
Figure 2: Typical Emulsion Modification Processes (9) ............................................................................. 12<br />
Figure 3: Surfactant Action <strong>in</strong> NRL <strong>Modified</strong> <strong>Asphalt</strong> Emulsion ................................................................. 13<br />
Figure 4: <strong>Polymer</strong> <strong>Modified</strong> Chip Seal ....................................................................................................... 13<br />
Figure 5: Cur<strong>in</strong>g of a CRS-2P Emulsion (14) ............................................................................................. 15<br />
Figure 6: Stone Retention over Cur<strong>in</strong>g Time (14) ...................................................................................... 16<br />
Figure 7: Wet Track Abrasion and Loaded Wheel Test by <strong>Polymer</strong> Type (14) .......................................... 16<br />
Figure 8: Fracture Toughness at -20º C. (33) ............................................................................................ 25<br />
Figure 9: Bi-Phase <strong>Modified</strong> Emulsion (47) ............................................................................................... 30<br />
Figure 10: <strong>Polymer</strong> Network <strong>in</strong> Cured, Co-Milled Emulsion (47) ............................................................... 30<br />
Figure 11: Pre-Blended <strong>Asphalt</strong>-<strong>Polymer</strong> Monophase (54) ....................................................................... 31<br />
Figure 12: (L to R) Unmodified, Co-Milled, and Pre-Blended Emulsion Test Results (4) .......................... 33<br />
Figure 13: Advantages of SBR Network (12) ............................................................................................. 33<br />
Figure 14: Complex Modulus over Mix<strong>in</strong>g Time (35) ................................................................................. 36<br />
Figure 15: Effect of SBS Concentration on PMA (16) ................................................................................ 37<br />
Figure 16: Effect of SBS Concentration on Complex Modulus at 60º C. (16) ........................................... 38<br />
Figure 17: Viscosity as a Function of SBS Concentration (12) .................................................................. 39<br />
Figure 18: Influence of Radial Tire on <strong>Surface</strong> Treatment (54) .................................................................. 44<br />
Figure 19: Microsurfac<strong>in</strong>g Emulsion Residue Cur<strong>in</strong>g Time (54) ................................................................ 55<br />
Figure 20: Chip Seal Aggregate Retention with <strong>Polymer</strong>s (66) ................................................................. 58<br />
Figure 21: Vialit Chip Retention at low Temperatures Chip Seals (4) ....................................................... 59<br />
Figure 22 Microsurfac<strong>in</strong>g Cur<strong>in</strong>g Time and Rut-Resistance (54) ................................................................ 61<br />
Figure 23: Wet Track Abrasion Losses (70) .............................................................................................. 62<br />
Figure 24: Loaded Wheel Test Results (70) .............................................................................................. 63<br />
Figure 25: Loaded Wheel Test Results (40) .............................................................................................. 64<br />
iv


