Women's Employment - United Nations Research Institute for Social ...
Women's Employment - United Nations Research Institute for Social ...
Women's Employment - United Nations Research Institute for Social ...

Create successful ePaper yourself
Turn your PDF publications into a flip-book with our unique Google optimized e-Paper software.
Women’s employment in the textile manufacturing sectors of Bangladesh and Morocco<br />
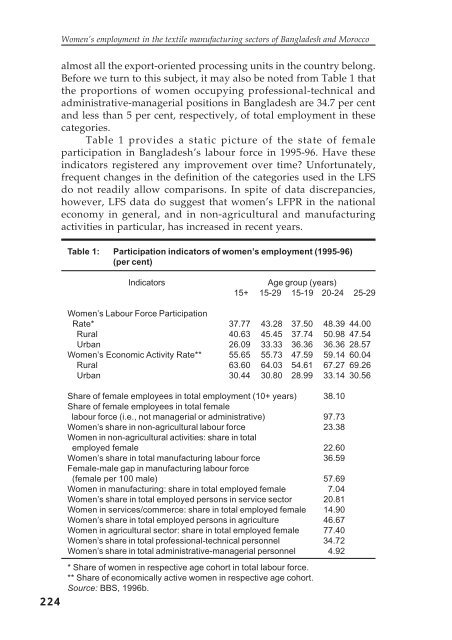
almost all the export-oriented processing units in the country belong.<br />
Be<strong>for</strong>e we turn to this subject, it may also be noted from Table 1 that<br />
the proportions of women occupying professional-technical and<br />
administrative-managerial positions in Bangladesh are 34.7 per cent<br />
and less than 5 per cent, respectively, of total employment in these<br />
categories.<br />
Table 1 provides a static picture of the state of female<br />
participation in Bangladesh’s labour <strong>for</strong>ce in 1995-96. Have these<br />
indicators registered any improvement over time? Un<strong>for</strong>tunately,<br />
frequent changes in the definition of the categories used in the LFS<br />
do not readily allow comparisons. In spite of data discrepancies,<br />
however, LFS data do suggest that women’s LFPR in the national<br />
economy in general, and in non-agricultural and manufacturing<br />
activities in particular, has increased in recent years.<br />
Table 1: Participation indicators of women’s employment (1995-96)<br />
(per cent)<br />
Indicators<br />
Age group (years)<br />
15+ 15-29 15-19 20-24 25-29<br />
224<br />
Women’s Labour Force Participation<br />
Rate* 37.77 43.28 37.50 48.39 44.00<br />
Rural 40.63 45.45 37.74 50.98 47.54<br />
Urban 26.09 33.33 36.36 36.36 28.57<br />
Women’s Economic Activity Rate** 55.65 55.73 47.59 59.14 60.04<br />
Rural 63.60 64.03 54.61 67.27 69.26<br />
Urban 30.44 30.80 28.99 33.14 30.56<br />
Share of female employees in total employment (10+ years) 38.10<br />
Share of female employees in total female<br />
labour <strong>for</strong>ce (i.e., not managerial or administrative) 97.73<br />
Women’s share in non-agricultural labour <strong>for</strong>ce 23.38<br />
Women in non-agricultural activities: share in total<br />
employed female 22.60<br />
Women’s share in total manufacturing labour <strong>for</strong>ce 36.59<br />
Female-male gap in manufacturing labour <strong>for</strong>ce<br />
(female per 100 male) 57.69<br />
Women in manufacturing: share in total employed female 7.04<br />
Women’s share in total employed persons in service sector 20.81<br />
Women in services/commerce: share in total employed female 14.90<br />
Women’s share in total employed persons in agriculture 46.67<br />
Women in agricultural sector: share in total employed female 77.40<br />
Women’s share in total professional-technical personnel 34.72<br />
Women’s share in total administrative-managerial personnel 4.92<br />
* Share of women in respective age cohort in total labour <strong>for</strong>ce.<br />
** Share of economically active women in respective age cohort.<br />
Source: BBS, 1996b.