- Page 1 and 2:
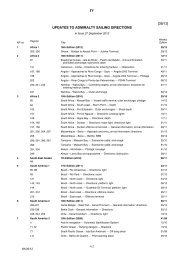
VI UPDATES TO ADMIRALTY LIST OF RAD
- Page 3 and 4:
VI PAGE 198, POLAND. Delete section
- Page 5 and 6:
VI VOLUME 6, PART 5, NP 286(5), 201
- Page 7 and 8:
VI 19, 31, 35 2012 32 2012 2, 14 49
- Page 9 and 10:
VI UPDATES TO ADMIRALTY LIST OF RAD
- Page 11 and 12:
VI PAGE 196, NETHERLANDS, Lekhaven
- Page 13 and 14:
VI MRSC BATANGAS - 5th District 43
- Page 15 and 16:
VI UPDATES TO ADMIRALTY LIST OF RAD
- Page 17 and 18:
VI UPDATES TO ADMIRALTY LIST OF RAD
- Page 19 and 20:
VI VOLUME 5, NP 285, 2012/13 Publis
- Page 21 and 22:
VI UPDATES TO ADMIRALTY LIST OF RAD
- Page 23 and 24:
VI WT (MF) TRAFFIC LISTS: 446·5 kH
- Page 25 and 26:
PAGE 56, above BAHRAIN. Insert: VI
- Page 27 and 28:
VI Baku (Chilov) [M] 40°19′⋅N6
- Page 29 and 30:
VI UPDATES TO ADMIRALTY LIST OF RAD
- Page 31 and 32:
VI PAGE 236, UNITED STATES (Gulf Co
- Page 33 and 34:
VI PAGE 276, PUERTO RICO (USA), San
- Page 35 and 36:
VI PAGE 301, 518 kHz NAVTEX BROADCA
- Page 37 and 38:
VI This does not include those vess
- Page 39 and 40:
VI FINAL REPORTS: (1) An AUSREP Fin
- Page 41 and 42:
VI ID Information Required This ite
- Page 43 and 44:
VI PAGE 155, INDIA, KOCHI (COCHIN),
- Page 45 and 46:
VI VOLUME 2, NP 282, 2012/13 Publis
- Page 47 and 48:
VI VOLUME 6, PART 1, NP 286(1), 201
- Page 49 and 50:
VI UPDATES TO ADMIRALTY LIST OF RAD
- Page 51 and 52:
VI PAGE 217, NAVAREA COORDINATORS t
- Page 53 and 54:
VI (3) Pre-Entry Report: To vessel
- Page 55 and 56:
VI UPDATES TO ADMIRALTY LIST OF RAD
- Page 57 and 58:
VI Bullockmore Lt Buoy 54°33′⋅
- Page 59 and 60:
VI VOLUME 6, PART 1, NP 286(1), 201
- Page 61 and 62:
VI VOLUME 6, PART 2, NP 286(2), 201
- Page 63 and 64:
VI VOLUME 6, PART 6, NP 286(6), 201
- Page 65 and 66:
VI RT (HF) TRAFFIC LISTS: 8740 8785
- Page 67 and 68:
VI PAGE 74, INDIA. 79200 Pºrºdip
- Page 69 and 70:
VI PAGE 174, CHINA, below Yantian G
- Page 71 and 72:
VI VOLUME 5, NP 285, 2012/13 Publis
- Page 73 and 74:
VI UPDATES TO ADMIRALTY LIST OF RAD
- Page 75 and 76:
VI SECTION 10: MF DSC, LIST OF COAS
- Page 77 and 78:
VI VOLUME 6, PART 1, NP 286(1), 201
- Page 79 and 80:
VI PROCEDURE: (1) Pilotage is compu
- Page 81 and 82:
VI VOLUME 3, PART 1, NP 283(1), 201
- Page 83 and 84:
VI VOLUME 6, PART 2, NP 286(2), 201
- Page 85 and 86:
VI PAGE 152, ICELAND. Insert: Grót
- Page 87 and 88:
VI VOLUME 5, NP 285, 2012/13 Publis
- Page 89 and 90:
VI VOLUME 6, PART 4, NP 286(4), 201
- Page 91 and 92:
VI PAGE 172, CHINA, below Xiazhi Me
- Page 93 and 94:
VI VOLUME 6, PART 1, NP 286(1), 201
- Page 95 and 96:
VI 30´ 69° 30´ 70° 30´ 30´ GU
- Page 97 and 98:
VI NOTES: (1) The Mooring Master an
- Page 99 and 100:
VI ADMIRALTY LIST OF RADIO SIGNALS
- Page 101 and 102:
VI DIAGRAMS Page 35 NAVTEX - Index
- Page 103 and 104:
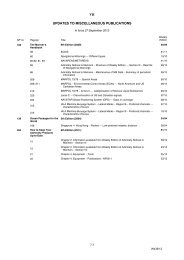
VII AMENDMENTS TO MISCELLANEOUS ADM
- Page 105 and 106:
VI RT (HF) Transmits Receives Hours
- Page 107 and 108:
VI B Ch 79 Néoulos / Port Vendres
- Page 109 and 110:
VI VOLUME 6, PART 1, NP 286(1), 201
- Page 111 and 112:
VI AUTOMATIC IDENTIFICATION SYSTEM
- Page 113 and 114:
VI AMENDMENTS TO ADMIRALTY LIST OF
- Page 115 and 116:
VI VOLUME 3, PART 1, NP 283(1), 201
- Page 117 and 118:
VI Kotka 002302000 60°27′N 26°5
- Page 119 and 120:
VI PAGE 262, CANADA (Atlantic Coast
- Page 121 and 122:
VI PAGE 277, Russia (Barents Sea Co
- Page 123 and 124:
VI PAGE 377, GEORGIA. Delete entry
- Page 125 and 126:
VI VOLUME 6, PART 1, NP 286(1), 201
- Page 127 and 128:
VI VOLUME 2, NP 282, 2012/13 Publis
- Page 129 and 130:
VI PAGE 294, 518 kHz NAVTEX BROADCA
- Page 131 and 132:
VI AMENDMENTS TO ADMIRALTY LIST OF
- Page 133 and 134:
VI O: 1820 (winter) 2220 (summer) I
- Page 135 and 136:
VI VOLUME 5, NP 285, 2011/12 Publis
- Page 137 and 138:
VI PAGE 261, CANADA (S. Lawrence Ri
- Page 139 and 140:
VI VOLUME 6, PART 1, NP 286(1), 201
- Page 141 and 142:
VI VOLUME 6, PART 1, NP 286(1), 201
- Page 143 and 144:
VI PAGE 380, SWEDEN, NYNÄSHAMN, Pi
- Page 145 and 146:
VI AMENDMENTS TO ADMIRALTY LIST OF
- Page 147 and 148:
VI VOLUME 5, NP 285, 2011/12 Publis
- Page 149 and 150:
VI 30´ 14° 30´ Landtief B GREIFS
- Page 151 and 152:
VI VOLUME 6, PART 4, NP 286(4), 201
- Page 153 and 154:
VI BATUMI MRSC 41°39′N 41°39′
- Page 155 and 156:
VI ROMÂNIA BULGARIYA (BULGARIA) UK
- Page 157 and 158:
VI PAGE 198, above POLAND section.
- Page 159 and 160:
VI VOLUME 6, PART 7, NP 286(7), 201
- Page 161 and 162:
PAGE 143, NORWAY, VARDØ. Delete st
- Page 163 and 164:
VI VOLUME 6, PART 4, NP 286(4), 201
- Page 165 and 166:
VI AMENDMENTS TO ADMIRALTY LIST OF
- Page 167 and 168:
VI PAGE 74, FINLAND, TURKU MRCC, VH
- Page 169 and 170:
VI VOLUME 3, PART 1, NP 283(1), 201
- Page 171 and 172:
VI SECTION 10: MF DSC, LIST OF COAS
- Page 173 and 174:
VI VOLUME 6, PART 1, NP 286(1), 201
- Page 175 and 176:
VI AMENDMENTS TO ADMIRALTY LIST OF
- Page 177 and 178:
VI VOLUME 6, PART 1, NP 286(1), 201
- Page 179 and 180:
VI AMENDMENTS TO ADMIRALTY LIST OF
- Page 181 and 182:
VI 3 48 hour wave period / swell di
- Page 183 and 184:
V3(2)USAHFFA V000 13/03/12 VI 30°
- Page 185 and 186:
VI VOLUME 6, PART 2, NP 286(2), 201
- Page 187 and 188:
VI LEGAL TIME CHILE 13 CUBA 13 EAST
- Page 189 and 190:
VI VOLUME 6, PART 5, NP 286(5), 201
- Page 191 and 192:
VI 5° 35° 40° 45° 50° SOMALIA
- Page 193 and 194:
VI INDEX OF GEOGRAPHICAL SECTIONS F
- Page 195 and 196:
VI RADAR BEACONS PAGE 26, DENMARK.
- Page 197 and 198:
VI A: On receipt B: On receipt Navi
- Page 199 and 200:
VI AMENDMENTS TO ADMIRALTY LIST OF
- Page 201 and 202:
VI PAGE 62, EGYPT (Red Sea Coast).
- Page 203 and 204:
VI PAGE 132, URUGUAY. Insert: Monte
- Page 205 and 206:
VI PAGE 176, DENMARK, Østerrenden
- Page 207 and 208:
VI VOLUME 6, PART 2, NP 286(2), 201
- Page 209 and 210:
VI VOLUME 6, PART 7, NP 286(7), 201
- Page 211 and 212:
VI PAGE 234, UNITED KINGDOM, CLYDE
- Page 213 and 214:
VI [H] Bjuröklubb Grindavik [X] [K
- Page 215 and 216:
VI VOLUME 5, NP 285, 2011/12 Publis
- Page 217 and 218:
VI [H] Bjuröklubb Grindavik [X] [K
- Page 219 and 220:
VI AMENDMENTS TO ADMIRALTY LIST OF
- Page 221 and 222:
VI PAGE 249, UNITED STATES (Alaska)
- Page 223 and 224:
VI VOLUME 6, PART 2, NP 286(2), 201
- Page 225 and 226:
VI wef 8 March 2012 PAGE 389, SWEDE
- Page 227 and 228:
VI PAGE 50, BOSTON (NMF), Schedule.
- Page 229 and 230:
VI VOLUME 5, NP 285, 2011/12 Publis
- Page 231 and 232:
VI VOLUME 2, NP 282, 2011/12 Publis
- Page 233 and 234:
VI AMENDMENTS TO ADMIRALTY LIST OF
- Page 235 and 236:
VI VOLUME 3, PART 1, NP 283(1), 201
- Page 237 and 238:
VI PAGE 156, RUSSIA (Arctic Coast),
- Page 239 and 240:
VI SECTION 16: DISTRESS, SEARCH AND
- Page 241 and 242:
VI AB³ M³SÁ RADIO (EQI10) 25°52
- Page 243 and 244:
VI Radiotelex [5300] Transmits Rece
- Page 245 and 246:
VI J†SK RADIO (EQT) 25°38′⋅9
- Page 247 and 248:
VI TI†B RADIO (EQI9) 27°06′⋅
- Page 249 and 250:
VI RT (HF) Transmits Receives Hours
- Page 251 and 252:
VI [T] [G] Tarifa II France [E] [U]
- Page 253 and 254:
VI SECTION 15: NAVTEX, STATIONS WIT
- Page 255 and 256:
VI VOLUME 6, PART 1, NP 286(1), 201
- Page 257 and 258:
VI PAGE 39, ANTARCTICA, after DAVIS
- Page 259 and 260:
VI PAGE 163, KOREA, SOUTH, Mineotan
- Page 261 and 262:
VI Tugs VHF Frequency: Ch 16; 09 11
- Page 263 and 264:
VI (5) The standard response messag
- Page 265 and 266:
VI Vessel Traffic Management System
- Page 267 and 268:
VI AMENDMENTS TO ADMIRALTY LIST OF
- Page 269 and 270:
VI VOLUME 6, PART 3, NP 286(3), 201
- Page 271 and 272:
VI NAVTEX PAGE 30, diagram, X4, NAV
- Page 273 and 274: VI VOLUME 5, NP 285, 2011/12 Publis
- Page 275 and 276: VI PAGE 91, CHILE, MAGALLANES, ESTR
- Page 277 and 278: HYDROGRAPHIC NOTE H.102 (ver 4.2 No
- Page 279 and 280: VI AMENDMENTS TO ADMIRALTY LIST OF
- Page 281 and 282: VI AMENDMENTS TO ADMIRALTY LIST OF
- Page 283 and 284: PAGE 120, ITALY, NAVTEX. Delete sec
- Page 285 and 286: PAGE 156, GREENLAND, NAVTEX. Delete
- Page 287 and 288: VI ŒA NANG (XVT) 7906 RT(HF) 8294
- Page 289 and 290: VI PHU YEN (XVY) A 7906 RT(HF) B Ch
- Page 291 and 292: VI PAGE 269, ITALY. Delete entry an
- Page 293 and 294: VI 110° 100° 75° 90° 80° XVIII
- Page 295 and 296: VI VOLUME 6, PART 1, NP 286(1), 201
- Page 297 and 298: VI 50´ 29°00´ 2 . ISTANBUL BOFAZ
- Page 299 and 300: VI (3) The sectors in İstanbul Bo
- Page 301 and 302: VI AUTOMATIC IDENTIFICATION SYSTEM
- Page 303 and 304: VI DIAGRAMS Page42GREAT BARRIERREEF
- Page 305 and 306: VI MahyadaÕi Ch 16 25 67 82 41°47
- Page 307 and 308: VI VOLUME 6, PART 1, NP 286(1), 201
- Page 309 and 310: VI 2 3 ° 2 4 ° 2 5 ° HELSINKI VE
- Page 311 and 312: VI PROCEDURE: (1) Compliance: Parti
- Page 313 and 314: VI PAGE 236, KOREA, SOUTH, INCHEON,
- Page 315 and 316: VI PAGE 251, KOREA, SOUTH, PYEONGTA
- Page 317 and 318: VI AUTOMATIC IDENTIFICATION SYSTEM
- Page 319 and 320: VI 30´ 26° 30´ 27° 30´ KOTKA V
- Page 321 and 322: 10m VI 50´ 21° 10´ 20´ 30´ 40
- Page 323: VI VOLUME 2, NP 282, 2011/12 Publis
- Page 327 and 328: VI 51° 50° 49° 48° 47° 46° 45
- Page 329 and 330: VI VOLUME 5, NP 285, 2011/12 Publis
- Page 331 and 332: VI 103° 40´ 45´ 50´ 55´ 104°
- Page 333 and 334: VI AMENDMENTS TO ADMIRALTY LIST OF
- Page 335 and 336: VI VOLUME 2, NP 282, 2011/12 Publis
- Page 337 and 338: VI Mediterranean Telephone +212 Fax
- Page 339 and 340: VI AMENDMENTS TO ADMIRALTY LIST OF
- Page 341 and 342: VI PAGE 270, VIETNAM, BAC LIÊU & B
- Page 343 and 344: VI 14° 13° 105° 106° 107° 108
- Page 345 and 346: VI DA NANG (XVT) 16°03′⋅53N 10
- Page 347 and 348: VI HON GAI (XVQ) 20°57′⋅00N 10
- Page 349 and 350: VI PHAN THIET (XVP) 10°54′⋅92N
- Page 351 and 352: VI VOLUME 2, NP 282, 2011/12 Publis
- Page 353 and 354: VI K: 0540 0940 1740 2140 X: 0350 0
- Page 355 and 356: VI KIEN GIANG (XVK) A 7906 RT(HF) B
- Page 357 and 358: VI VOLUME 5, NP 285, 2011/12 Publis
- Page 359 and 360: VI SECTION 15: NAVTEX, STATIONS WIT
- Page 361 and 362: VI VOLUME 6, PART 1, NP 286(1), 201
- Page 363 and 364: VI V6(3)BRINDISI V000 27/10/11 40´
- Page 365 and 366: VI 30´ 122° 30´ YANGSHAN VESSEL