Room for Savings: Optimizing Hotel Spend - Carlson
Room for Savings: Optimizing Hotel Spend - Carlson
Room for Savings: Optimizing Hotel Spend - Carlson

Create successful ePaper yourself
Turn your PDF publications into a flip-book with our unique Google optimized e-Paper software.
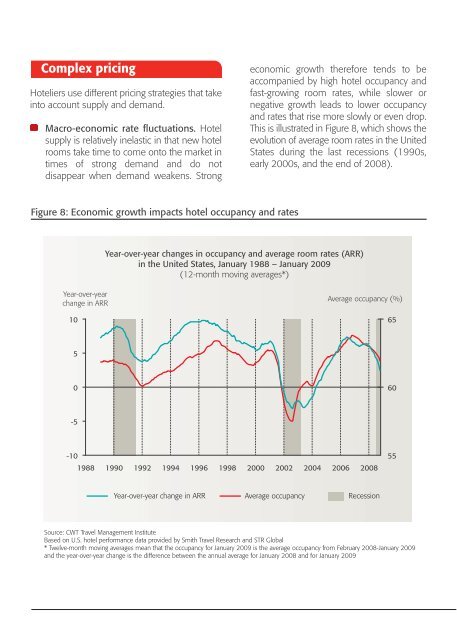
Complex pricing<br />
<strong>Hotel</strong>iers use different pricing strategies that take<br />
into account supply and demand.<br />
Macro-economic rate fluctuations. <strong>Hotel</strong><br />
supply is relatively inelastic in that new hotel<br />
rooms take time to come onto the market in<br />
times of strong demand and do not<br />
disappear when demand weakens. Strong<br />
economic growth there<strong>for</strong>e tends to be<br />
accompanied by high hotel occupancy and<br />
fast-growing room rates, while slower or<br />
negative growth leads to lower occupancy<br />
and rates that rise more slowly or even drop.<br />
This is illustrated in Figure 8, which shows the<br />
evolution of average room rates in the United<br />
States during the last recessions (1990s,<br />
early 2000s, and the end of 2008).<br />
Figure 8: Economic growth impacts hotel occupancy and rates<br />
Year-over-year changes in occupancy and average room rates (ARR)<br />
in the United States, January 1988 – January 2009<br />
(12-month moving averages*)<br />
Year-over-year<br />
change in ARR<br />
10<br />
Average occupancy (%)<br />
65<br />
5<br />
0<br />
60<br />
-5<br />
-10<br />
1988 1990 1992 1994 1996 1998 2000 2002 2004 2006 2008<br />
55<br />
Year-over-year change in ARR Average occupancy Recession<br />
Source: CWT Travel Management Institute<br />
Based on U.S. hotel per<strong>for</strong>mance data provided by Smith Travel Research and STR Global<br />
* Twelve-month moving averages mean that the occupancy <strong>for</strong> January 2009 is the average occupancy from February 2008-January 2009<br />
and the year-over-year change is the difference between the annual average <strong>for</strong> January 2008 and <strong>for</strong> January 2009