Room for Savings: Optimizing Hotel Spend - Carlson
Room for Savings: Optimizing Hotel Spend - Carlson
Room for Savings: Optimizing Hotel Spend - Carlson

You also want an ePaper? Increase the reach of your titles
YUMPU automatically turns print PDFs into web optimized ePapers that Google loves.
Data on hotel spend is however, notoriously<br />
difficult to obtain, implying that many companies<br />
may not have accurate figures. (This challenge is<br />
described further on Pages 32-36.) CWT<br />
there<strong>for</strong>e carried out analyses to evaluate the<br />
typical share of hotel spend in the transient travel<br />
budget. Three different methodologies produced<br />
matching results, as described below.<br />
1.“Top-down” global market analysis:<br />
39% of total travel spend<br />
CWT analyzed data on the global business travel<br />
market (hotel, air, rail and rental car) <strong>for</strong> 12<br />
major countries (Australia, Brazil, Canada, China,<br />
France, Germany, India, Italy, Japan, Spain, the<br />
United Kingdom and the United States) to<br />
evaluate the share of hotel spend. Several<br />
sources were used, including travel suppliers,<br />
travel booking in<strong>for</strong>mation, trade associations,<br />
business intelligence companies and<br />
international institutions. The analysis separated<br />
transient travel from meetings and events spend.<br />
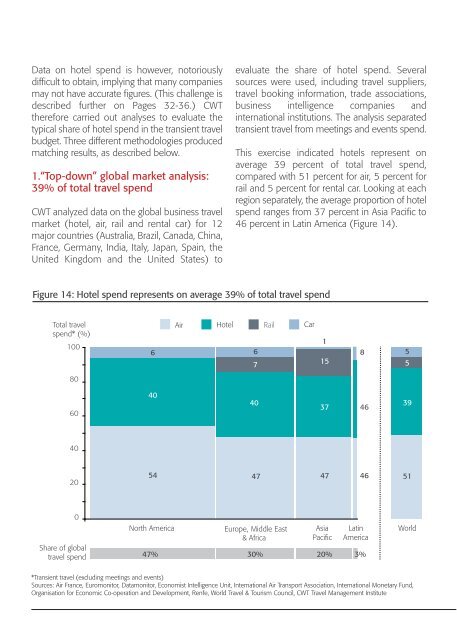
This exercise indicated hotels represent on<br />
average 39 percent of total travel spend,<br />
compared with 51 percent <strong>for</strong> air, 5 percent <strong>for</strong><br />
rail and 5 percent <strong>for</strong> rental car. Looking at each<br />
region separately, the average proportion of hotel<br />
spend ranges from 37 percent in Asia Pacific to<br />
46 percent in Latin America (Figure 14).<br />
Figure 14: <strong>Hotel</strong> spend represents on average 39% of total travel spend<br />
Total travel<br />
spend* (%)<br />
100<br />
6<br />
Air<br />
<strong>Hotel</strong><br />
6<br />
7<br />
Rail<br />
Car<br />
1<br />
15<br />
8 5<br />
5<br />
80<br />
60<br />
40<br />
40<br />
37<br />
46<br />
39<br />
40<br />
20<br />
54<br />
47 47 46<br />
51<br />
0<br />
Share of global<br />
travel spend<br />
North America<br />
47%<br />
Europe, Middle East<br />
& Africa<br />
Asia<br />
Pacific<br />
Latin<br />
America<br />
30% 20% 3%<br />
World<br />
*Transient travel (excluding meetings and events)<br />
Sources: Air France, Euromonitor, Datamonitor, Economist Intelligence Unit, International Air Transport Association, International Monetary Fund,<br />
Organisation <strong>for</strong> Economic Co-operation and Development, Renfe, World Travel & Tourism Council, CWT Travel Management Institute