100 % FUTURE - ALNO
100 % FUTURE - ALNO
100 % FUTURE - ALNO

You also want an ePaper? Increase the reach of your titles
YUMPU automatically turns print PDFs into web optimized ePapers that Google loves.
103<br />
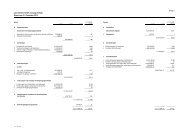
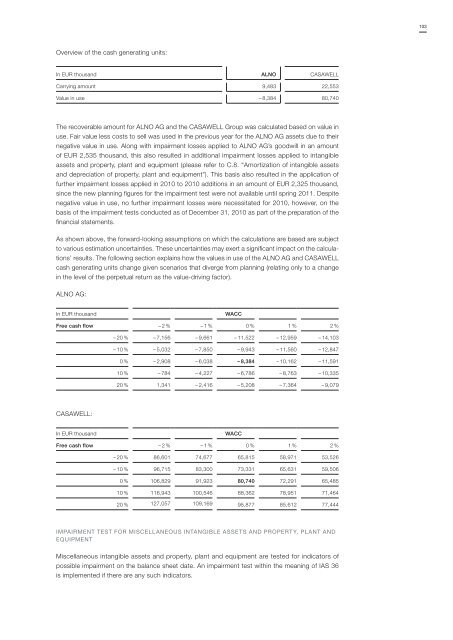
Overview of the cash generating units:<br />
In EUR thousand <strong>ALNO</strong> CASAWELL<br />
Carrying amount 9,483 22,553<br />
Value in use – 8,384 80,740<br />
The recoverable amount for <strong>ALNO</strong> AG and the CASAWELL Group was calculated based on value in<br />
use. Fair value less costs to sell was used in the previous year for the <strong>ALNO</strong> AG assets due to their<br />
negative value in use. Along with impairment losses applied to <strong>ALNO</strong> AG’s goodwill in an amount<br />
of EUR 2,535 thousand, this also resulted in additional impairment losses applied to intangible<br />
assets and property, plant and equipment (please refer to C.8. “Amortization of intangible assets<br />
and depreciation of property, plant and equipment”). This basis also resulted in the application of<br />
further impairment losses applied in 2010 to 2010 additions in an amount of EUR 2,325 thousand,<br />
since the new planning figures for the impairment test were not available until spring 2011. Despite<br />
negative value in use, no further impairment losses were necessitated for 2010, however, on the<br />
basis of the impairment tests conducted as of December 31, 2010 as part of the preparation of the<br />
financial statements.<br />
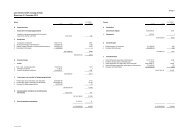
As shown above, the forward-looking assumptions on which the calculations are based are subject<br />
to various estimation uncertainties. These uncertainties may exert a significant impact on the calculations’<br />
results. The following section explains how the values in use of the <strong>ALNO</strong> AG and CASAWELL<br />
cash generating units change given scenarios that diverge from planning (relating only to a change<br />
in the level of the perpetual return as the value-driving factor).<br />
<strong>ALNO</strong> AG:<br />
In EUR thousand<br />
WACC<br />
Free cash flow – 2 % – 1 % 0 % 1 % 2 %<br />
– 20 % – 7,156 – 9,661 – 11,522 – 12,959 – 14,103<br />
– 10 % – 5,032 – 7,850 – 9,943 – 11,560 – 12,847<br />
0 % – 2,908 – 6,038 – 8,384 – 10,162 – 11,591<br />
10 % – 784 – 4,227 – 6,786 – 8,763 – 10,335<br />
20 % 1,341 – 2,416 – 5,208 – 7,364 – 9,079<br />
CASAWELL:<br />
In EUR thousand<br />
WACC<br />
Free cash flow – 2 % – 1 % 0 % 1 % 2 %<br />
– 20 % 86,601 74,677 65,815 58,971 53,526<br />
– 10 % 96,715 83,300 73,331 65,631 59,506<br />
0 % 106,829 91,923 80,740 72,291 65,485<br />
10 % 116,943 <strong>100</strong>,546 88,362 78,951 71,464<br />
20 % 127,057 109,169 95,877 85,612 77,444<br />
IMPAIRMENT TEST FOR MISCELLANEOUS INTANGIBLE ASSETS AND PROPERTY, PLANT AND<br />
eqUIPMENT<br />
Miscellaneous intangible assets and property, plant and equipment are tested for indicators of<br />
possible impairment on the balance sheet date. An impairment test within the meaning of IAS 36<br />
is implemented if there are any such indicators.