100 % FUTURE - ALNO
100 % FUTURE - ALNO
100 % FUTURE - ALNO

You also want an ePaper? Increase the reach of your titles
YUMPU automatically turns print PDFs into web optimized ePapers that Google loves.
135<br />
2009<br />
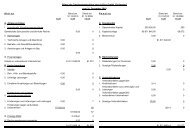
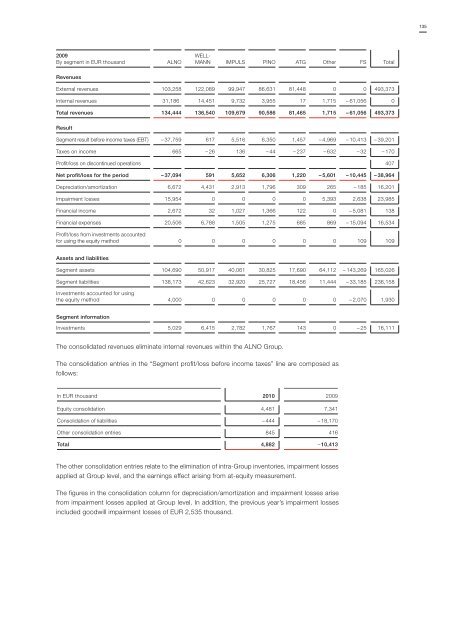
By segment in EUR thousand<br />
<strong>ALNO</strong><br />
WELL-<br />
MANN IMPULS PINO ATG Other FS Total<br />
Revenues<br />
External revenues 103,258 122,089 99,947 86,631 81,448 0 0 493,373<br />
Internal revenues 31,186 14,451 9,732 3,955 17 1,715 – 61,056 0<br />
Total revenues 134,444 136,540 109,679 90,586 81,465 1,715 – 61,056 493,373<br />
Result<br />
Segment result before income taxes (EBT) – 37,759 617 5,516 6,350 1,457 – 4,969 – 10,413 – 39,201<br />
Taxes on income 665 – 26 136 – 44 – 237 – 632 – 32 – 170<br />
Profit/loss on discontinued operations 407<br />
Net profit/loss for the period – 37,094 591 5,652 6,306 1,220 – 5,601 – 10,445 – 38,964<br />
Depreciation/amortization 6,672 4,431 2,913 1,796 309 265 – 185 16,201<br />
Impairment losses 15,954 0 0 0 0 5,393 2,638 23,985<br />
Financial income 2,672 32 1,027 1,366 122 0 – 5,081 138<br />
Financial expenses 20,506 6,788 1,505 1,275 685 869 – 15,094 16,534<br />
Profit/loss from investments accounted<br />
for using the equity method 0 0 0 0 0 0 109 109<br />
Assets and liabilities<br />
Segment assets 104,690 50,917 40,061 30,825 17,690 64,112 – 143,269 165,026<br />
Segment liabilities 138,173 42,623 32,920 25,727 18,456 11,444 – 33,185 236,158<br />
Investments accounted for using<br />
the equity method 4,000 0 0 0 0 0 – 2,070 1,930<br />
Segment information<br />
Investments 5,029 6,415 2,782 1,767 143 0 – 25 16,111<br />
The consolidated revenues eliminate internal revenues within the <strong>ALNO</strong> Group.<br />
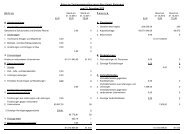
The consolidation entries in the “Segment profit/loss before income taxes” line are composed as<br />
follows:<br />
In EUR thousand 2010 2009<br />
Equity consolidation 4,481 7,341<br />
Consolidation of liabilities – 444 – 18,170<br />
Other consolidation entries 845 416<br />
Total 4,882 – 10,413<br />
The other consolidation entries relate to the elimination of intra-Group inventories, impairment losses<br />
applied at Group level, and the earnings effect arising from at-equity measurement.<br />
The figures in the consolidation column for depreciation/amortization and impairment losses arise<br />
from impairment losses applied at Group level. In addition, the previous year’s impairment losses<br />
included goodwill impairment losses of EUR 2,535 thousand.