Low_resolution_Thesis_CDD_221009_public - Visual Optics and ...
Low_resolution_Thesis_CDD_221009_public - Visual Optics and ...
Low_resolution_Thesis_CDD_221009_public - Visual Optics and ...

Create successful ePaper yourself
Turn your PDF publications into a flip-book with our unique Google optimized e-Paper software.
CORRELATION BETWEEN RADIUS AND ASPHERICITY<br />
simulated corneal topography measurements of pairs of corneal surfaces. One cornea<br />
had R=8 mm <strong>and</strong> Q=0.3 in all cases, while in the other R took values between 8 <strong>and</strong><br />
8.1 mm (Fig. A.8(a)), or Q took values between 0.3 <strong>and</strong> 0.5 (Fig. A.8(b)). To simulate<br />
realistic corneal topography measurements, Gaussian noise (with a st<strong>and</strong>ard deviation<br />
of 10 m) was added to the ellipsoid. Each simulated experimental session consisted<br />
on five measurements per cornea. Each pair of series of 5 measurements each was<br />
compared, to estimate whether the two corneal surfaces were statistically different.<br />
Each experimental session was repeated 1000 times to obtain accurate probability<br />
estimates. Two statistical methods were tested: separate t-tests on R <strong>and</strong> Q (with <strong>and</strong><br />
without the Bonferroni correction) <strong>and</strong> the MANOVA test proposed in this study.<br />
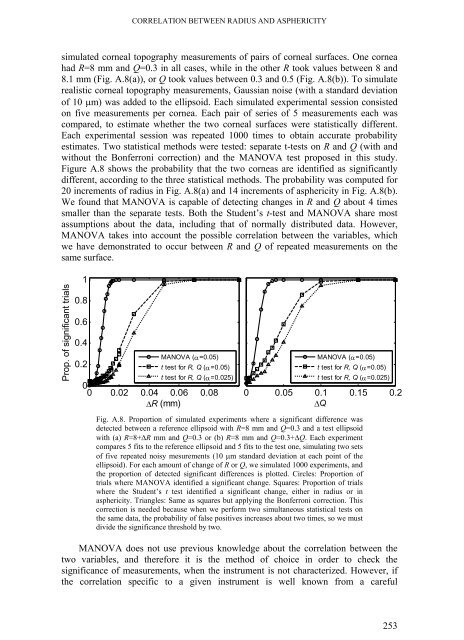
Figure A.8 shows the probability that the two corneas are identified as significantly<br />
different, according to the three statistical methods. The probability was computed for<br />
20 increments of radius in Fig. A.8(a) <strong>and</strong> 14 increments of asphericity in Fig. A.8(b).<br />
We found that MANOVA is capable of detecting changes in R <strong>and</strong> Q about 4 times<br />
smaller than the separate tests. Both the Student’s t-test <strong>and</strong> MANOVA share most<br />
assumptions about the data, including that of normally distributed data. However,<br />
MANOVA takes into account the possible correlation between the variables, which<br />
we have demonstrated to occur between R <strong>and</strong> Q of repeated measurements on the<br />
same surface.<br />
Prop. of significant trials<br />
1<br />
0.8<br />
0.6<br />
0.4<br />
0.2<br />
MANOVA (=0.05)<br />
t test for R, Q (=0.05)<br />
t test for R, Q (=0.025)<br />
0<br />
0 0.02 0.04 0.06 0.08<br />
R (mm)<br />
MANOVA (=0.05)<br />
t test for R, Q (=0.05)<br />
t test for R, Q (=0.025)<br />
0 0.05 0.1 0.15 0.2<br />
Q<br />
Fig. A.8. Proportion of simulated experiments where a significant difference was<br />
detected between a reference ellipsoid with R=8 mm <strong>and</strong> Q=0.3 <strong>and</strong> a test ellipsoid<br />
with (a) R=8+R mm <strong>and</strong> Q=0.3 or (b) R=8 mm <strong>and</strong> Q=0.3+Q. Each experiment<br />
compares 5 fits to the reference ellipsoid <strong>and</strong> 5 fits to the test one, simulating two sets<br />
of five repeated noisy mesurements (10 m st<strong>and</strong>ard deviation at each point of the<br />
ellipsoid). For each amount of change of R or Q, we simulated 1000 experiments, <strong>and</strong><br />
the proportion of detected significant differences is plotted. Circles: Proportion of<br />
trials where MANOVA identified a significant change. Squares: Proportion of trials<br />
where the Student’s t test identified a significant change, either in radius or in<br />
asphericity. Triangles: Same as squares but applying the Bonferroni correction. This<br />
correction is needed because when we perform two simultaneous statistical tests on<br />
the same data, the probability of false positives increases about two times, so we must<br />
divide the significance threshold by two.<br />
MANOVA does not use previous knowledge about the correlation between the<br />
two variables, <strong>and</strong> therefore it is the method of choice in order to check the<br />
significance of measurements, when the instrument is not characterized. However, if<br />
the correlation specific to a given instrument is well known from a careful<br />
253