Low_resolution_Thesis_CDD_221009_public - Visual Optics and ...
Low_resolution_Thesis_CDD_221009_public - Visual Optics and ...
Low_resolution_Thesis_CDD_221009_public - Visual Optics and ...

You also want an ePaper? Increase the reach of your titles
YUMPU automatically turns print PDFs into web optimized ePapers that Google loves.
CHAPTER 2<br />
thickness map, the same base sphere (typically the one corresponding to the anterior<br />
cornea) has to be substracted from both surfaces. The shape of the lens appears more<br />
clearly, as a positive or negative meniscus, depending on the lens power. To study the<br />
lens flexure or conformity to the underlying cornea, each of base spheres has to be<br />
substracted to each from the corresponding surfaces.<br />
2.2.2.4. Representing surfaces<br />
Throughout this thesis we have used different graphical representations for analysing<br />
the optical surfaces measured. Three dimensional scattered points plots (as those<br />
shown in Figs. 2.16 <strong>and</strong> 2.17) are often used to represent raw measurement (or<br />
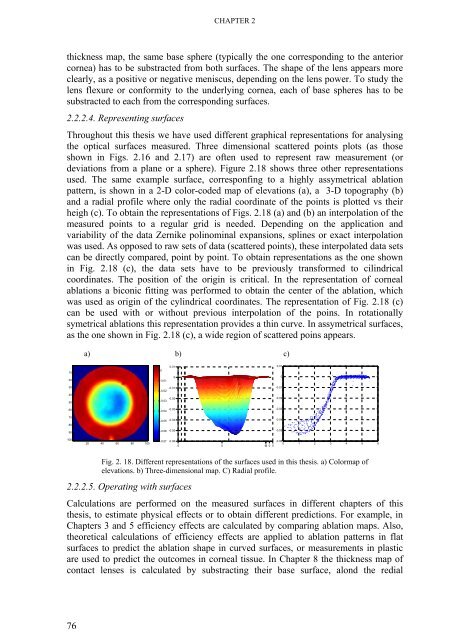
deviations from a plane or a sphere). Figure 2.18 shows three other representations<br />
used. The same example surface, corresponfing to a highly assymetrical ablation<br />
pattern, is shown in a 2-D color-coded map of elevations (a), a 3-D topography (b)<br />
<strong>and</strong> a radial profile where only the radial coordinate of the points is plotted vs their<br />
heigh (c). To obtain the representations of Figs. 2.18 (a) <strong>and</strong> (b) an interpolation of the<br />
measured points to a regular grid is needed. Depending on the application <strong>and</strong><br />
variability of the data Zernike polinominal expansions, splines or exact interpolation<br />
was used. As opposed to raw sets of data (scattered points), these interpolated data sets<br />
can be directly compared, point by point. To obtain representations as the one shown<br />
in Fig. 2.18 (c), the data sets have to be previously transformed to cilindrical<br />
coordinates. The position of the origin is critical. In the representation of corneal<br />
ablations a biconic fitting was performed to obtain the center of the ablation, which<br />
was used as origin of the cylindrical coordinates. The representation of Fig. 2.18 (c)<br />
can be used with or without previous interpolation of the poins. In rotationally<br />
symetrical ablations this representation provides a thin curve. In assymetrical surfaces,<br />
as the one shown in Fig. 2.18 (c), a wide region of scattered poins appears.<br />
a) b) c)<br />
10<br />
20<br />
30<br />
40<br />
50<br />
60<br />
70<br />
80<br />
90<br />
0.01<br />
0<br />
0<br />
-0.01<br />
-0.01<br />
-0.02<br />
-0.02<br />
-0.03<br />
-0.03<br />
-0.04<br />
-0.05 -0.04<br />
-0.06 -0.05<br />
0.01<br />
0<br />
-0.01<br />
-0.02<br />
-0.03<br />
-0.04<br />
-0.05<br />
100<br />
20 40 60 80 100<br />
-0.07<br />
-0.06<br />
-5 0 -5 0 5<br />
-0.06<br />
0 1 2 3 4 5 6<br />
Fig. 2. 18. Different representations of the surfaces used in this thesis. a) Colormap of<br />
elevations. b) Three-dimensional map. C) Radial profile.<br />
2.2.2.5. Operating with surfaces<br />
Calculations are performed on the measured surfaces in different chapters of this<br />
thesis, to estimate physical effects or to obtain different predictions. For example, in<br />
Chapters 3 <strong>and</strong> 5 efficiency effects are calculated by comparing ablation maps. Also,<br />
theoretical calculations of efficiency effects are applied to ablation patterns in flat<br />
surfaces to predict the ablation shape in curved surfaces, or measurements in plastic<br />
are used to predict the outcomes in corneal tissue. In Chapter 8 the thickness map of<br />
contact lenses is calculated by substracting their base surface, alond the redial<br />
76