Annual Report 2004-2005 - City of Vincent
Annual Report 2004-2005 - City of Vincent
Annual Report 2004-2005 - City of Vincent

You also want an ePaper? Increase the reach of your titles
YUMPU automatically turns print PDFs into web optimized ePapers that Google loves.
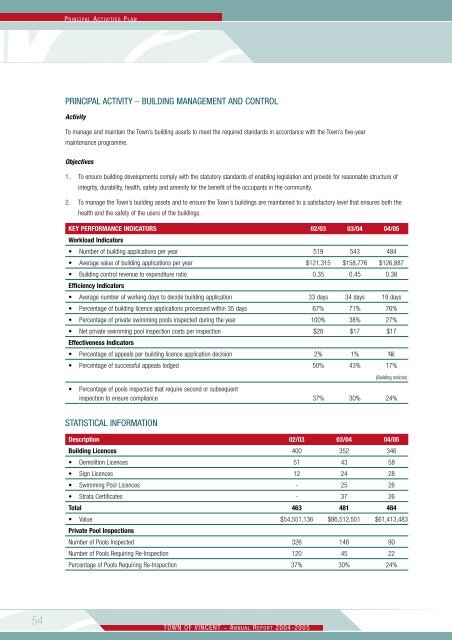
P RINCIPAL A CTIVITIES P LAN<br />
PRINCIPAL ACTIVITY _ BUILDING MANAGEMENT AND CONTROL<br />
Activity<br />
To manage and maintain the Town’s building assets to meet the required standards in accordance with the Town’s five-year<br />
maintenance programme.<br />
Objectives<br />
1. To ensure building developments comply with the statutory standards <strong>of</strong> enabling legislation and provide for reasonable structure <strong>of</strong><br />
integrity, durability, health, safety and amenity for the benefit <strong>of</strong> the occupants in the community.<br />
2. To manage the Town’s building assets and to ensure the Town’s buildings are maintained to a satisfactory level that ensures both the<br />
health and the safety <strong>of</strong> the users <strong>of</strong> the buildings.<br />
KEY PERFORMANCE INDICATORS 02/03 03/04 04/05<br />
Workload Indicators<br />
• Number <strong>of</strong> building applications per year 519 543 484<br />
• Average value <strong>of</strong> building applications per year $121,315 $158,776 $126,887<br />
• Building control revenue to expenditure ratio 0.35 0.45 0.38<br />
Efficiency Indicators<br />
• Average number <strong>of</strong> working days to decide building application 33 days 34 days 19 days<br />
• Percentage <strong>of</strong> building licence applications processed within 35 days 67% 71% 76%<br />
• Percentage <strong>of</strong> private swimming pools inspected during the year 100% 38% 27%<br />
• Net private swimming pool inspection costs per inspection $28 $17 $17<br />
Effectiveness Indicators<br />
• Percentage <strong>of</strong> appeals per building licence application decision 2% 1% Nil<br />
• Percentage <strong>of</strong> successful appeals lodged 50% 43% 17%<br />
(Building notices)<br />
• Percentage <strong>of</strong> pools inspected that require second or subsequent<br />
inspection to ensure compliance 37% 30% 24%<br />
STATISTICAL INFORMATION<br />
Description 02/03 03/04 04/05<br />
Building Licences 400 352 346<br />
• Demolition Licences 51 43 58<br />
• Sign Licences 12 24 28<br />
• Swimming Pool Licences - 25 26<br />
• Strata Certificates - 37 26<br />
Total 463 481 484<br />
• Value $54,551,136 $86,512,551 $61,413,483<br />
Private Pool Inspections<br />
Number <strong>of</strong> Pools Inspected 326 148 90<br />
Number <strong>of</strong> Pools Requiring Re-Inspection 120 45 22<br />
Percentage <strong>of</strong> Pools Requiring Re-Inspection 37% 30% 24%<br />
54<br />
TOWN OF VINCENT _ A NNUAL R EPORT <strong>2004</strong>-<strong>2005</strong>