

A N N U A L R E P O R T A N D A C C O U N T S - CMVM
A N N U A L R E P O R T A N D A C C O U N T S - CMVM
A N N U A L R E P O R T A N D A C C O U N T S - CMVM

Create successful ePaper yourself
Turn your PDF publications into a flip-book with our unique Google optimized e-Paper software.
Management Report of the Board of Directors - Financial Year 2008<br />
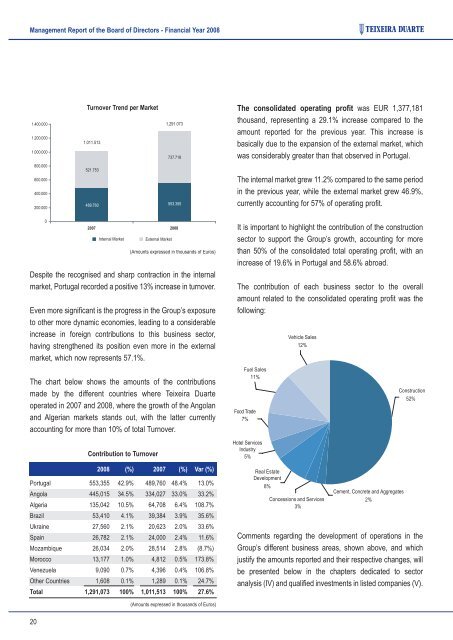
Turnover Trend per Market<br />
The consolidated operating profit was EUR 1,377,181<br />
thousand, representing a 29.1% increase compared to the<br />
amount reported for the previous year. This increase is<br />
basically due to the expansion of the external market, which<br />
was considerably greater than that observed in Portugal.<br />
The internal market grew 11.2% compared to the same period<br />
in the previous year, while the external market grew 46.9%,<br />
currently accounting for 57% of operating profit.<br />
(Amounts expressed in thousands of Euros)<br />
Despite the recognised and sharp contraction in the internal<br />
market, Portugal recorded a positive 13% increase in turnover.<br />
Even more significant is the progress in the Group’s exposure<br />
to other more dynamic economies, leading to a considerable<br />
increase in foreign contributions to this business sector,<br />
having strengthened its position even more in the external<br />
market, which now represents 57.1%.<br />
It is important to highlight the contribution of the construction<br />
sector to support the Group’s growth, accounting for more<br />
than 50% of the consolidated total operating profit, with an<br />
increase of 19.6% in Portugal and 58.6% abroad.<br />
The contribution of each business sector to the overall<br />
amount related to the consolidated operating profit was the<br />
following:<br />
The chart below shows the amounts of the contributions<br />
made by the different countries where Teixeira Duarte<br />
operated in 2007 and 2008, where the growth of the Angolan<br />
and Algerian markets stands out, with the latter currently<br />
accounting for more than 10% of total Turnover.<br />
Contribution to Turnover<br />
2008 (%) 2007 (%) Var (%)<br />
Portugal 553,355 42.9% 489,760 48.4% 13.0%<br />
Angola 445,015 34.5% 334,027 33.0% 33.2%<br />
Algeria 135,042 10.5% 64,708 6.4% 108.7%<br />
Brazil 53,410 4.1% 39,384 3.9% 35.6%<br />
Ukraine 27,560 2.1% 20,623 2.0% 33.6%<br />
Spain 26,782 2.1% 24,000 2.4% 11.6%<br />
Mozambique 26,034 2.0% 28,514 2.8% (8.7%)<br />
Morocco 13,177 1.0% 4,812 0.5% 173.8%<br />
Venezuela 9,090 0.7% 4,396 0.4% 106.8%<br />
Other Countries 1,608 0.1% 1,289 0.1% 24.7%<br />
Total 1,291,073 100% 1,011,513 100% 27.6%<br />
Comments regarding the development of operations in the<br />
Group’s different business areas, shown above, and which<br />
justify the amounts reported and their respective changes, will<br />
be presented below in the chapters dedicated to sector<br />
analysis (IV) and qualified investments in listed companies (V).<br />
(Amounts expressed in thousands of Euros)<br />
20


