East Bay Jewish Community Study - Jewish Federation of the ...
East Bay Jewish Community Study - Jewish Federation of the ...
East Bay Jewish Community Study - Jewish Federation of the ...

Create successful ePaper yourself
Turn your PDF publications into a flip-book with our unique Google optimized e-Paper software.
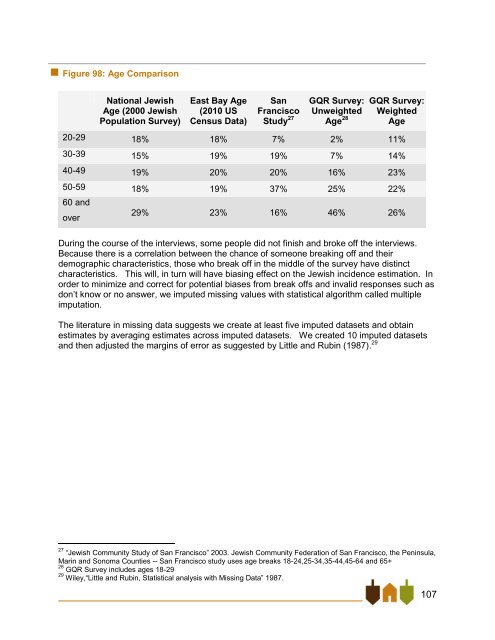
Figure 98: Age Comparison<br />
National <strong>Jewish</strong><br />
Age (2000 <strong>Jewish</strong><br />
Population Survey)<br />
<strong>East</strong> <strong>Bay</strong> Age<br />
(2010 US<br />
Census Data)<br />
San<br />
Francisco<br />
<strong>Study</strong> 27<br />
GQR Survey:<br />
Unweighted<br />
Age 28<br />
GQR Survey:<br />
Weighted<br />
Age<br />
20-29 18% 18% 7% 2% 11%<br />
30-39 15% 19% 19% 7% 14%<br />
40-49 19% 20% 20% 16% 23%<br />
50-59 18% 19% 37% 25% 22%<br />
60 and<br />
over<br />
29% 23% 16% 46% 26%<br />
During <strong>the</strong> course <strong>of</strong> <strong>the</strong> interviews, some people did not finish and broke <strong>of</strong>f <strong>the</strong> interviews.<br />
Because <strong>the</strong>re is a correlation between <strong>the</strong> chance <strong>of</strong> someone breaking <strong>of</strong>f and <strong>the</strong>ir<br />
demographic characteristics, those who break <strong>of</strong>f in <strong>the</strong> middle <strong>of</strong> <strong>the</strong> survey have distinct<br />
characteristics. This will, in turn will have biasing effect on <strong>the</strong> <strong>Jewish</strong> incidence estimation. In<br />
order to minimize and correct for potential biases from break <strong>of</strong>fs and invalid responses such as<br />
don’t know or no answer, we imputed missing values with statistical algorithm called multiple<br />
imputation.<br />
The literature in missing data suggests we create at least five imputed datasets and obtain<br />
estimates by averaging estimates across imputed datasets. We created 10 imputed datasets<br />
and <strong>the</strong>n adjusted <strong>the</strong> margins <strong>of</strong> error as suggested by Little and Rubin (1987). 29<br />
27 ―<strong>Jewish</strong> <strong>Community</strong> <strong>Study</strong> <strong>of</strong> San Francisco‖ 2003. <strong>Jewish</strong> <strong>Community</strong> <strong>Federation</strong> <strong>of</strong> San Francisco, <strong>the</strong> Peninsula,<br />
Marin and Sonoma Counties -- San Francisco study uses age breaks 18-24,25-34,35-44,45-64 and 65+<br />
28 GQR Survey includes ages 18-29<br />
29 Wiley,―Little and Rubin, Statistical analysis with Missing Data‖ 1987.<br />
107