East Bay Jewish Community Study - Jewish Federation of the ...
East Bay Jewish Community Study - Jewish Federation of the ...
East Bay Jewish Community Study - Jewish Federation of the ...

You also want an ePaper? Increase the reach of your titles
YUMPU automatically turns print PDFs into web optimized ePapers that Google loves.
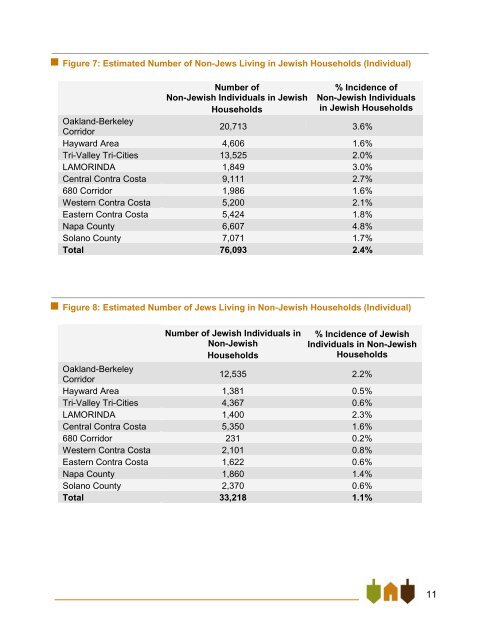
Figure 7: Estimated Number <strong>of</strong> Non-Jews Living in <strong>Jewish</strong> Households (Individual)<br />
Number <strong>of</strong><br />
Non-<strong>Jewish</strong> Individuals in <strong>Jewish</strong><br />
Households<br />
% Incidence <strong>of</strong><br />
Non-<strong>Jewish</strong> Individuals<br />
in <strong>Jewish</strong> Households<br />
Oakland-Berkeley<br />
Corridor<br />
20,713 3.6%<br />
Hayward Area 4,606 1.6%<br />
Tri-Valley Tri-Cities 13,525 2.0%<br />
LAMORINDA 1,849 3.0%<br />
Central Contra Costa 9,111 2.7%<br />
680 Corridor 1,986 1.6%<br />
Western Contra Costa 5,200 2.1%<br />
<strong>East</strong>ern Contra Costa 5,424 1.8%<br />
Napa County 6,607 4.8%<br />
Solano County 7,071 1.7%<br />
Total 76,093 2.4%<br />
Figure 8: Estimated Number <strong>of</strong> Jews Living in Non-<strong>Jewish</strong> Households (Individual)<br />
Number <strong>of</strong> <strong>Jewish</strong> Individuals in<br />
Non-<strong>Jewish</strong><br />
Households<br />
% Incidence <strong>of</strong> <strong>Jewish</strong><br />
Individuals in Non-<strong>Jewish</strong><br />
Households<br />
Oakland-Berkeley<br />
Corridor<br />
12,535 2.2%<br />
Hayward Area 1,381 0.5%<br />
Tri-Valley Tri-Cities 4,367 0.6%<br />
LAMORINDA 1,400 2.3%<br />
Central Contra Costa 5,350 1.6%<br />
680 Corridor 231 0.2%<br />
Western Contra Costa 2,101 0.8%<br />
<strong>East</strong>ern Contra Costa 1,622 0.6%<br />
Napa County 1,860 1.4%<br />
Solano County 2,370 0.6%<br />
Total 33,218 1.1%<br />
11