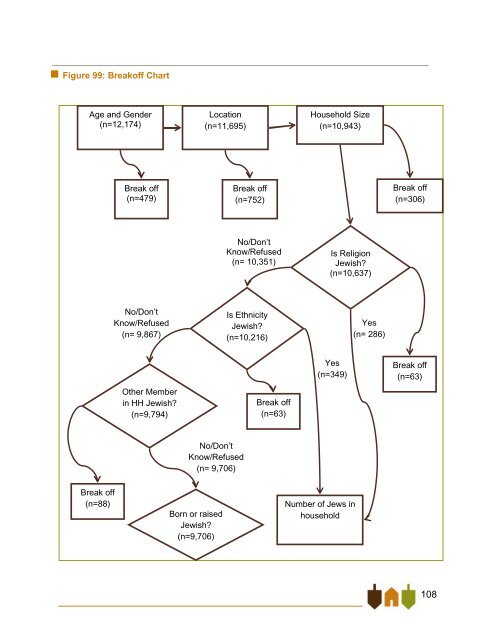
Figure 99: Break<strong>of</strong>f Chart Age and Gender (n=12,174) Location (n=11,695) Household Size (n=10,943) Break <strong>of</strong>f (n=479) Break <strong>of</strong>f (n=752) Break <strong>of</strong>f (n=306) No/Don’t Know/Refused (n= 10,351) Is Religion <strong>Jewish</strong> (n=10,637) No/Don’t Know/Refused (n= 9,867) Is Ethnicity <strong>Jewish</strong> (n=10,216) Yes (n= 286) O<strong>the</strong>r Member in HH <strong>Jewish</strong> (n=9,794) Break <strong>of</strong>f (n=63) Yes (n=349) Break <strong>of</strong>f (n=63) No/Don’t Know/Refused (n= 9,706) Break <strong>of</strong>f (n=88) Born or raised <strong>Jewish</strong> (n=9,706) Number <strong>of</strong> Jews in household 108
Sampling Error The margin <strong>of</strong> <strong>the</strong> sampling error for <strong>the</strong> total survey <strong>of</strong> 820 <strong>Jewish</strong> households is +/- 3.2 percentage points. Within <strong>the</strong> RDD portion <strong>of</strong> <strong>the</strong> sample, <strong>the</strong> margin <strong>of</strong> error is +/- 8.2 percentage points. The margins <strong>of</strong> error for <strong>the</strong> population estimates by region are as follows: Figure 100: Margin <strong>of</strong> Error by Region Total Jews Standard Error Margin <strong>of</strong> Error 95% Confidence Interval Lower Upper Oakland-Berkeley Corridor 64,220 5,353 10,492 53,728 74,712 Hayward Area 9,955 3,164 6,201 3,754 16,156 Tri-valley Tri-cities 23,720 3,888 7,620 16,100 31,341 LAMORINDA 5,013 1,827 3,581 1,433 8,594 Central Contra Costa 22,207 3,427 6,717 15,490 28,924 680 Corridor 6,379 2,458 4,818 1,561 11,196 Western Contra Costa 11,376 1,803 3,533 7,843 14,910 <strong>East</strong>ern Contra Costa 10,672 2,752 5,394 5,278 16,066 Solano County 12,076 2,837 5,560 6,516 17,636 Napa County 11,197 4,573 8,963 2,235 20,160 Total 176,816 10,425 20,433 156,383 197,249 Please note that <strong>the</strong> margin <strong>of</strong> error estimates do not account for sources <strong>of</strong> error o<strong>the</strong>r than sampling error, such as self-selection bias, attrition bias, or exclusion bias. The overall margin <strong>of</strong> error estimates are <strong>the</strong> most conservative estimates <strong>of</strong> <strong>the</strong> margin <strong>of</strong> error and apply when percentages are close to 50 percent. As percentages move closer to 0 or 100, <strong>the</strong> margin <strong>of</strong> error shrinks. Please see <strong>the</strong> table below for guidance. Also remember that subpopulations will have a larger margin <strong>of</strong> error. 109
- Page 3 and 4:
East Bay Jewish Community Study Pla
- Page 5:
The Jewish Federation of the East B
- Page 9 and 10:
Executive Summary The Jewish Commun
- Page 11 and 12:
• A plurality (33 percent) identi
- Page 13:
• Most parents who want to give t
- Page 16 and 17:
Among the smaller geographic areas
- Page 18 and 19:
Additional Estimates In addition to
- Page 21 and 22:
Demographic Characteristics of the
- Page 23 and 24:
The average household size in the E
- Page 25 and 26:
Figure 14: Income by Region Last ye
- Page 27 and 28:
Geography and Mobility A plurality
- Page 29 and 30:
Residents of the Oakland-Berkeley C
- Page 31:
Most residents, even those under ag
- Page 34 and 35:
Jewish Identification As a starting
- Page 36 and 37:
Overall, a plurality of East Bay Je
- Page 38 and 39:
Demographically, intermarried Jewis
- Page 40 and 41:
Jewish Identity There is a strong s
- Page 42 and 43:
Having a Jewish family is not the h
- Page 44 and 45:
Similarly, the practices of the int
- Page 46 and 47:
General Involvement More than 40 pe
- Page 48 and 49:
Synagogue and Organizational Member
- Page 50 and 51:
Synagogue membership is higher amon
- Page 52 and 53:
The highest level of synagogue memb
- Page 54 and 55:
Residents who belong to a Jewish or
- Page 56 and 57:
Informal Participation in Jewish Li
- Page 58 and 59:
Regionally, volunteers are distribu
- Page 60 and 61:
Those residents most likely to atte
- Page 62 and 63:
Spiritual event attendees are more
- Page 65 and 66: Tzedakah in the Jewish Community A
- Page 67 and 68: Financially, donors to Israel and n
- Page 69 and 70: Geographically, Jewish Federation o
- Page 71 and 72: Feelings about the Jewish Community
- Page 73 and 74: A majority (54 percent) of intermar
- Page 75: The most negative views held about
- Page 78 and 79: Family Size Just over one-quarter o
- Page 80 and 81: Although 42 percent of younger Jews
- Page 82 and 83: Overall, a majority of Jewish paren
- Page 84 and 85: Figure 72: Overall Contribution to
- Page 86 and 87: This group already participates in
- Page 88 and 89: The biggest barriers for those who
- Page 90 and 91: Forty-one percent of younger Jews g
- Page 92 and 93: Older and younger Jews also use a d
- Page 94 and 95: “Jew-ish” in the East Bay Anoth
- Page 96 and 97: Almost 90 percent think that helpin
- Page 98 and 99: Although financially the ―Jew-ish
- Page 100 and 101: More than half of the unaffiliated
- Page 102 and 103: Unaffiliated Jews do not purport to
- Page 104 and 105: Research Definitions A Jewish adult
- Page 106 and 107: Figure 93: Redefined Regional Defin
- Page 108 and 109: Figure 95: Screener Questions 100
- Page 110 and 111: method for introducing cell phone s
- Page 112 and 113: Total RDD Listed Landline Listed Ce
- Page 114 and 115: In general, the Jewish population s
- Page 118 and 119: Figure 101: Sampling Error by Perce
- Page 120 and 121: Appendix B: Demographic Study Frequ
- Page 122 and 123: Q.19 I am going to read you a list
- Page 124 and 125: Not Very/ Nt Too/ Impt Very Smwt To
- Page 126 and 127: Q.51 Are you legally married, in a
- Page 128 and 129: Q.57 (IF SINGLE, PARTNER BUT NOT LI
- Page 130 and 131: Strng Smwt Smwt Strng DK/ Total Tot
- Page 132 and 133: Q.82 How long have you lived in the
- Page 134 and 135: Q.92 Which of the following orienta
- Page 136: Q.9 How many landlines do you have