East Bay Jewish Community Study - Jewish Federation of the ...
East Bay Jewish Community Study - Jewish Federation of the ...
East Bay Jewish Community Study - Jewish Federation of the ...

Create successful ePaper yourself
Turn your PDF publications into a flip-book with our unique Google optimized e-Paper software.
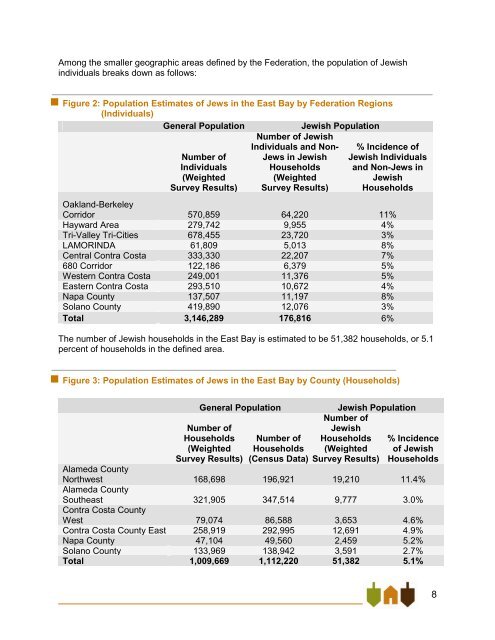
Among <strong>the</strong> smaller geographic areas defined by <strong>the</strong> <strong>Federation</strong>, <strong>the</strong> population <strong>of</strong> <strong>Jewish</strong><br />
individuals breaks down as follows:<br />
Figure 2: Population Estimates <strong>of</strong> Jews in <strong>the</strong> <strong>East</strong> <strong>Bay</strong> by <strong>Federation</strong> Regions<br />
(Individuals)<br />
General Population<br />
<strong>Jewish</strong> Population<br />
Number <strong>of</strong> <strong>Jewish</strong><br />
Number <strong>of</strong><br />
Individuals<br />
(Weighted<br />
Survey Results)<br />
Individuals and Non-<br />
Jews in <strong>Jewish</strong><br />
Households<br />
(Weighted<br />
Survey Results)<br />
% Incidence <strong>of</strong><br />
<strong>Jewish</strong> Individuals<br />
and Non-Jews in<br />
<strong>Jewish</strong><br />
Households<br />
Oakland-Berkeley<br />
Corridor 570,859 64,220 11%<br />
Hayward Area 279,742 9,955 4%<br />
Tri-Valley Tri-Cities 678,455 23,720 3%<br />
LAMORINDA 61,809 5,013 8%<br />
Central Contra Costa 333,330 22,207 7%<br />
680 Corridor 122,186 6,379 5%<br />
Western Contra Costa 249,001 11,376 5%<br />
<strong>East</strong>ern Contra Costa 293,510 10,672 4%<br />
Napa County 137,507 11,197 8%<br />
Solano County 419,890 12,076 3%<br />
Total 3,146,289 176,816 6%<br />
The number <strong>of</strong> <strong>Jewish</strong> households in <strong>the</strong> <strong>East</strong> <strong>Bay</strong> is estimated to be 51,382 households, or 5.1<br />
percent <strong>of</strong> households in <strong>the</strong> defined area.<br />
Figure 3: Population Estimates <strong>of</strong> Jews in <strong>the</strong> <strong>East</strong> <strong>Bay</strong> by County (Households)<br />
General Population<br />
Number <strong>of</strong><br />
Households<br />
(Weighted<br />
Survey Results)<br />
Number <strong>of</strong><br />
Households<br />
(Census Data)<br />
<strong>Jewish</strong> Population<br />
Number <strong>of</strong><br />
<strong>Jewish</strong><br />
Households<br />
(Weighted<br />
Survey Results)<br />
% Incidence<br />
<strong>of</strong> <strong>Jewish</strong><br />
Households<br />
Alameda County<br />
Northwest 168,698 196,921 19,210 11.4%<br />
Alameda County<br />
Sou<strong>the</strong>ast 321,905 347,514 9,777 3.0%<br />
Contra Costa County<br />
West 79,074 86,588 3,653 4.6%<br />
Contra Costa County <strong>East</strong> 258,919 292,995 12,691 4.9%<br />
Napa County 47,104 49,560 2,459 5.2%<br />
Solano County 133,969 138,942 3,591 2.7%<br />
Total 1,009,669 1,112,220 51,382 5.1%<br />
8