East Bay Jewish Community Study - Jewish Federation of the ...
East Bay Jewish Community Study - Jewish Federation of the ...
East Bay Jewish Community Study - Jewish Federation of the ...

Create successful ePaper yourself
Turn your PDF publications into a flip-book with our unique Google optimized e-Paper software.
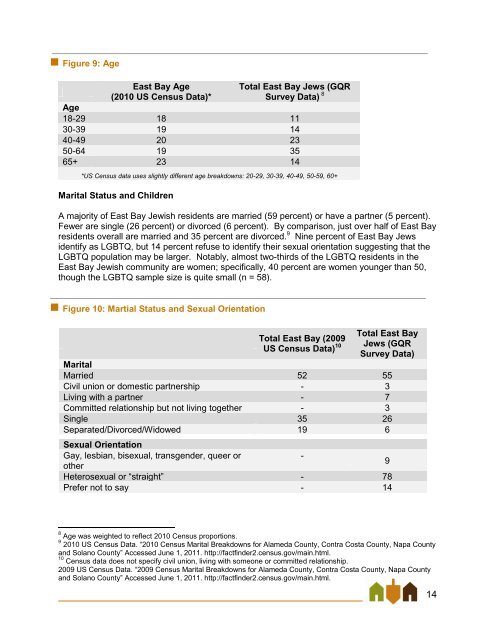
Figure 9: Age<br />
<strong>East</strong> <strong>Bay</strong> Age<br />
(2010 US Census Data)*<br />
Marital Status and Children<br />
Total <strong>East</strong> <strong>Bay</strong> Jews (GQR<br />
Survey Data) 8<br />
Age<br />
18-29 18 11<br />
30-39 19 14<br />
40-49 20 23<br />
50-64 19 35<br />
65+ 23 14<br />
*US Census data uses slightly different age breakdowns: 20-29, 30-39, 40-49, 50-59, 60+<br />
A majority <strong>of</strong> <strong>East</strong> <strong>Bay</strong> <strong>Jewish</strong> residents are married (59 percent) or have a partner (5 percent).<br />
Fewer are single (26 percent) or divorced (6 percent). By comparison, just over half <strong>of</strong> <strong>East</strong> <strong>Bay</strong><br />
residents overall are married and 35 percent are divorced. 9 Nine percent <strong>of</strong> <strong>East</strong> <strong>Bay</strong> Jews<br />
identify as LGBTQ, but 14 percent refuse to identify <strong>the</strong>ir sexual orientation suggesting that <strong>the</strong><br />
LGBTQ population may be larger. Notably, almost two-thirds <strong>of</strong> <strong>the</strong> LGBTQ residents in <strong>the</strong><br />
<strong>East</strong> <strong>Bay</strong> <strong>Jewish</strong> community are women; specifically, 40 percent are women younger than 50,<br />
though <strong>the</strong> LGBTQ sample size is quite small (n = 58).<br />
Figure 10: Martial Status and Sexual Orientation<br />
Total <strong>East</strong> <strong>Bay</strong> (2009<br />
US Census Data) 10<br />
Total <strong>East</strong> <strong>Bay</strong><br />
Jews (GQR<br />
Survey Data)<br />
Marital<br />
Married 52 55<br />
Civil union or domestic partnership - 3<br />
Living with a partner - 7<br />
Committed relationship but not living toge<strong>the</strong>r - 3<br />
Single 35 26<br />
Separated/Divorced/Widowed 19 6<br />
Sexual Orientation<br />
Gay, lesbian, bisexual, transgender, queer or<br />
-<br />
o<strong>the</strong>r<br />
9<br />
Heterosexual or ―straight‖ - 78<br />
Prefer not to say - 14<br />
8 Age was weighted to reflect 2010 Census proportions.<br />
9 2010 US Census Data. ―2010 Census Marital Breakdowns for Alameda County, Contra Costa County, Napa County<br />
and Solano County‖ Accessed June 1, 2011. http://factfinder2.census.gov/main.html.<br />
10 Census data does not specify civil union, living with someone or committed relationship.<br />
2009 US Census Data. ―2009 Census Marital Breakdowns for Alameda County, Contra Costa County, Napa County<br />
and Solano County‖ Accessed June 1, 2011. http://factfinder2.census.gov/main.html.<br />
14