East Bay Jewish Community Study - Jewish Federation of the ...
East Bay Jewish Community Study - Jewish Federation of the ...
East Bay Jewish Community Study - Jewish Federation of the ...

Create successful ePaper yourself
Turn your PDF publications into a flip-book with our unique Google optimized e-Paper software.
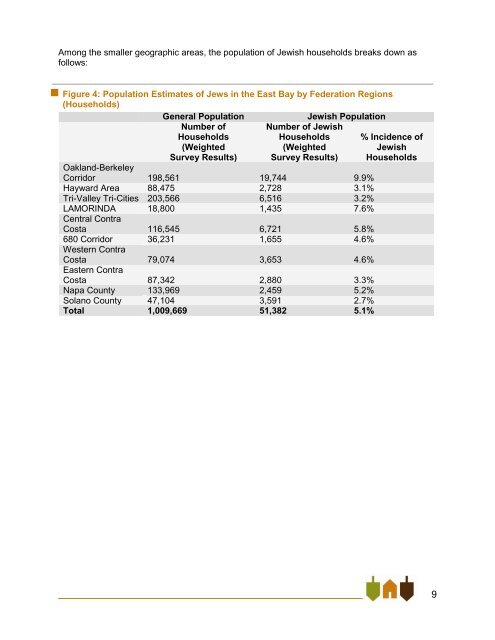
Among <strong>the</strong> smaller geographic areas, <strong>the</strong> population <strong>of</strong> <strong>Jewish</strong> households breaks down as<br />
follows:<br />
Figure 4: Population Estimates <strong>of</strong> Jews in <strong>the</strong> <strong>East</strong> <strong>Bay</strong> by <strong>Federation</strong> Regions<br />
(Households)<br />
General Population<br />
<strong>Jewish</strong> Population<br />
Number <strong>of</strong> Number <strong>of</strong> <strong>Jewish</strong><br />
Households<br />
Households<br />
(Weighted<br />
(Weighted<br />
Survey Results) Survey Results)<br />
Oakland-Berkeley<br />
Corridor 198,561 19,744 9.9%<br />
Hayward Area 88,475 2,728 3.1%<br />
Tri-Valley Tri-Cities 203,566 6,516 3.2%<br />
LAMORINDA 18,800 1,435 7.6%<br />
Central Contra<br />
Costa 116,545 6,721 5.8%<br />
680 Corridor 36,231 1,655 4.6%<br />
Western Contra<br />
Costa 79,074 3,653 4.6%<br />
<strong>East</strong>ern Contra<br />
Costa 87,342 2,880 3.3%<br />
Napa County 133,969 2,459 5.2%<br />
Solano County 47,104 3,591 2.7%<br />
Total 1,009,669 51,382 5.1%<br />
% Incidence <strong>of</strong><br />
<strong>Jewish</strong><br />
Households<br />
9