East Bay Jewish Community Study - Jewish Federation of the ...
East Bay Jewish Community Study - Jewish Federation of the ...
East Bay Jewish Community Study - Jewish Federation of the ...

Create successful ePaper yourself
Turn your PDF publications into a flip-book with our unique Google optimized e-Paper software.
Younger Jews in <strong>the</strong> <strong>East</strong> <strong>Bay</strong><br />
Younger Jews, <strong>the</strong> future <strong>of</strong> <strong>the</strong> <strong>Jewish</strong> population in <strong>the</strong> <strong>East</strong> <strong>Bay</strong>, have had a different and<br />
distinct <strong>Jewish</strong> experience. They are <strong>the</strong> most likely to have been raised in an interfaith family<br />
and, as a result, are less likely to be conversant with all aspects <strong>of</strong> <strong>Jewish</strong> life and ritual. They<br />
also incorporate more aspects <strong>of</strong> Christianity into <strong>the</strong>ir lives, evidenced by <strong>the</strong> fact that <strong>the</strong>y say<br />
that a belief in God is very important to being <strong>Jewish</strong> and <strong>the</strong>y <strong>of</strong>ten have a Christmas tree. On<br />
<strong>the</strong> o<strong>the</strong>r hand, <strong>the</strong>y are slightly more likely to say <strong>the</strong>y would like to be more involved in <strong>the</strong><br />
<strong>Jewish</strong> community.<br />
Just 25 percent <strong>of</strong> <strong>the</strong> <strong>Jewish</strong> population in <strong>the</strong> <strong>East</strong> <strong>Bay</strong> is under <strong>the</strong> age <strong>of</strong> 40, though this<br />
survey likely under represents youth. Demographically, <strong>the</strong>re are several interesting points<br />
about this group. Unmarried women make up more than one-third <strong>of</strong> <strong>the</strong> 18-to 39-year-old<br />
<strong>Jewish</strong> population in <strong>the</strong> <strong>East</strong> <strong>Bay</strong>, a higher proportion than any o<strong>the</strong>r age group in <strong>the</strong> area.<br />
There are also a higher proportion <strong>of</strong> African Americans in this group (11 percent) than in any<br />
o<strong>the</strong>r age cohort. Finally, just under one-quarter <strong>of</strong> respondents report being out <strong>of</strong> work, higher<br />
than any o<strong>the</strong>r age group; note that <strong>the</strong>se respondents are different from students (12 percent).<br />
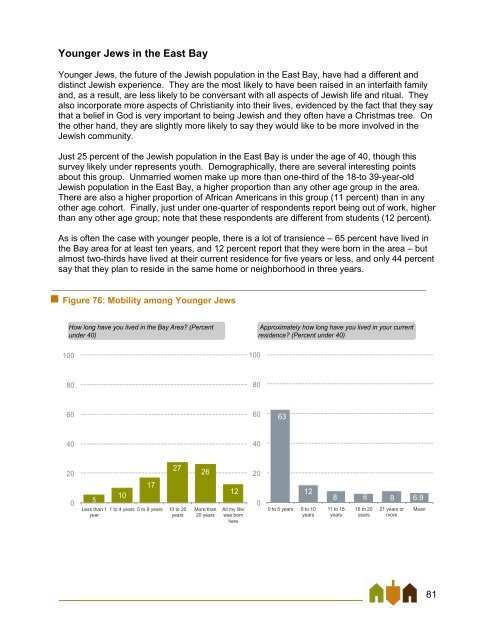
As is <strong>of</strong>ten <strong>the</strong> case with younger people, <strong>the</strong>re is a lot <strong>of</strong> transience – 65 percent have lived in<br />
<strong>the</strong> <strong>Bay</strong> area for at least ten years, and 12 percent report that <strong>the</strong>y were born in <strong>the</strong> area – but<br />
almost two-thirds have lived at <strong>the</strong>ir current residence for five years or less, and only 44 percent<br />
say that <strong>the</strong>y plan to reside in <strong>the</strong> same home or neighborhood in three years.<br />
Figure 76: Mobility among Younger Jews<br />
How long have you lived in <strong>the</strong> <strong>Bay</strong> Area (Percent<br />
under 40)<br />
100<br />
100<br />
Approximately how long have you lived in your current<br />
residence (Percent under 40)<br />
80<br />
80<br />
60<br />
60<br />
63<br />
40<br />
40<br />
20<br />
0<br />
5<br />
Less than 1<br />
year<br />
10<br />
17<br />
27<br />
1 to 4 years 5 to 9 years 10 to 20<br />
years<br />
26<br />
More than<br />
20 years<br />
12<br />
All my life/<br />
was born<br />
here<br />
20<br />
0<br />
12<br />
0 to 5 years 6 to 10<br />
years<br />
8 6 8 6.9<br />
11 to 15<br />
years<br />
16 to 20<br />
years<br />
21 years or<br />
more<br />
Mean<br />
81