East Bay Jewish Community Study - Jewish Federation of the ...
East Bay Jewish Community Study - Jewish Federation of the ...
East Bay Jewish Community Study - Jewish Federation of the ...

Create successful ePaper yourself
Turn your PDF publications into a flip-book with our unique Google optimized e-Paper software.
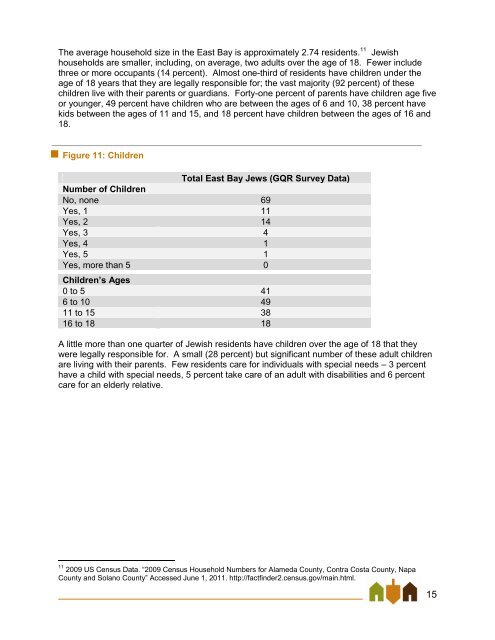
The average household size in <strong>the</strong> <strong>East</strong> <strong>Bay</strong> is approximately 2.74 residents. 11 <strong>Jewish</strong><br />
households are smaller, including, on average, two adults over <strong>the</strong> age <strong>of</strong> 18. Fewer include<br />
three or more occupants (14 percent). Almost one-third <strong>of</strong> residents have children under <strong>the</strong><br />
age <strong>of</strong> 18 years that <strong>the</strong>y are legally responsible for; <strong>the</strong> vast majority (92 percent) <strong>of</strong> <strong>the</strong>se<br />
children live with <strong>the</strong>ir parents or guardians. Forty-one percent <strong>of</strong> parents have children age five<br />
or younger, 49 percent have children who are between <strong>the</strong> ages <strong>of</strong> 6 and 10, 38 percent have<br />
kids between <strong>the</strong> ages <strong>of</strong> 11 and 15, and 18 percent have children between <strong>the</strong> ages <strong>of</strong> 16 and<br />
18.<br />
Figure 11: Children<br />
Total <strong>East</strong> <strong>Bay</strong> Jews (GQR Survey Data)<br />
Number <strong>of</strong> Children<br />
No, none 69<br />
Yes, 1 11<br />
Yes, 2 14<br />
Yes, 3 4<br />
Yes, 4 1<br />
Yes, 5 1<br />
Yes, more than 5 0<br />
Children’s Ages<br />
0 to 5 41<br />
6 to 10 49<br />
11 to 15 38<br />
16 to 18 18<br />
A little more than one quarter <strong>of</strong> <strong>Jewish</strong> residents have children over <strong>the</strong> age <strong>of</strong> 18 that <strong>the</strong>y<br />
were legally responsible for. A small (28 percent) but significant number <strong>of</strong> <strong>the</strong>se adult children<br />
are living with <strong>the</strong>ir parents. Few residents care for individuals with special needs – 3 percent<br />
have a child with special needs, 5 percent take care <strong>of</strong> an adult with disabilities and 6 percent<br />
care for an elderly relative.<br />
11 2009 US Census Data. ―2009 Census Household Numbers for Alameda County, Contra Costa County, Napa<br />
County and Solano County‖ Accessed June 1, 2011. http://factfinder2.census.gov/main.html.<br />
15