Chapter 9 - Instructional Media: Chalkboards to Video - CGISS
Chapter 9 - Instructional Media: Chalkboards to Video - CGISS
Chapter 9 - Instructional Media: Chalkboards to Video - CGISS

You also want an ePaper? Increase the reach of your titles
YUMPU automatically turns print PDFs into web optimized ePapers that Google loves.
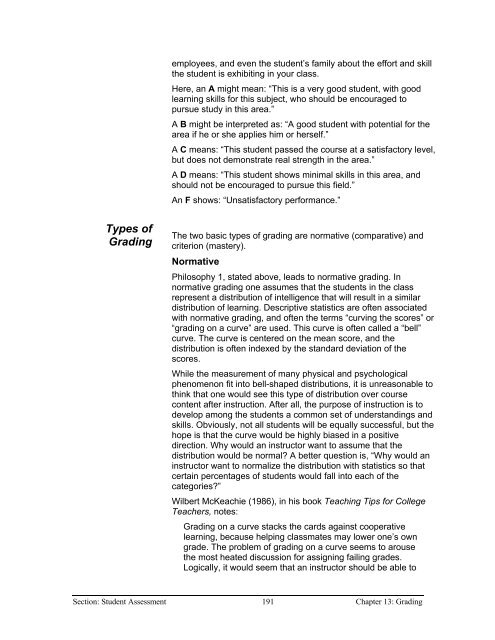
employees, and even the student’s family about the effort and skill<br />
the student is exhibiting in your class.<br />
Here, an A might mean: “This is a very good student, with good<br />
learning skills for this subject, who should be encouraged <strong>to</strong><br />
pursue study in this area.”<br />
A B might be interpreted as: “A good student with potential for the<br />
area if he or she applies him or herself.”<br />
A C means: “This student passed the course at a satisfac<strong>to</strong>ry level,<br />
but does not demonstrate real strength in the area.”<br />
A D means: “This student shows minimal skills in this area, and<br />
should not be encouraged <strong>to</strong> pursue this field.”<br />
An F shows: “Unsatisfac<strong>to</strong>ry performance.”<br />
Types of<br />
Grading<br />
The two basic types of grading are normative (comparative) and<br />
criterion (mastery).<br />
Normative<br />
Philosophy 1, stated above, leads <strong>to</strong> normative grading. In<br />
normative grading one assumes that the students in the class<br />
represent a distribution of intelligence that will result in a similar<br />
distribution of learning. Descriptive statistics are often associated<br />
with normative grading, and often the terms “curving the scores” or<br />
“grading on a curve” are used. This curve is often called a “bell”<br />
curve. The curve is centered on the mean score, and the<br />
distribution is often indexed by the standard deviation of the<br />
scores.<br />
While the measurement of many physical and psychological<br />
phenomenon fit in<strong>to</strong> bell-shaped distributions, it is unreasonable <strong>to</strong><br />
think that one would see this type of distribution over course<br />
content after instruction. After all, the purpose of instruction is <strong>to</strong><br />
develop among the students a common set of understandings and<br />
skills. Obviously, not all students will be equally successful, but the<br />
hope is that the curve would be highly biased in a positive<br />
direction. Why would an instruc<strong>to</strong>r want <strong>to</strong> assume that the<br />
distribution would be normal A better question is, “Why would an<br />
instruc<strong>to</strong>r want <strong>to</strong> normalize the distribution with statistics so that<br />
certain percentages of students would fall in<strong>to</strong> each of the<br />
categories”<br />
Wilbert McKeachie (1986), in his book Teaching Tips for College<br />
Teachers, notes:<br />
Grading on a curve stacks the cards against cooperative<br />
learning, because helping classmates may lower one’s own<br />
grade. The problem of grading on a curve seems <strong>to</strong> arouse<br />
the most heated discussion for assigning failing grades.<br />
Logically, it would seem that an instruc<strong>to</strong>r should be able <strong>to</strong><br />
Section: Student Assessment 191 <strong>Chapter</strong> 13: Grading