ABN AMRO Funds - Aia.com.hk
ABN AMRO Funds - Aia.com.hk
ABN AMRO Funds - Aia.com.hk

Create successful ePaper yourself
Turn your PDF publications into a flip-book with our unique Google optimized e-Paper software.
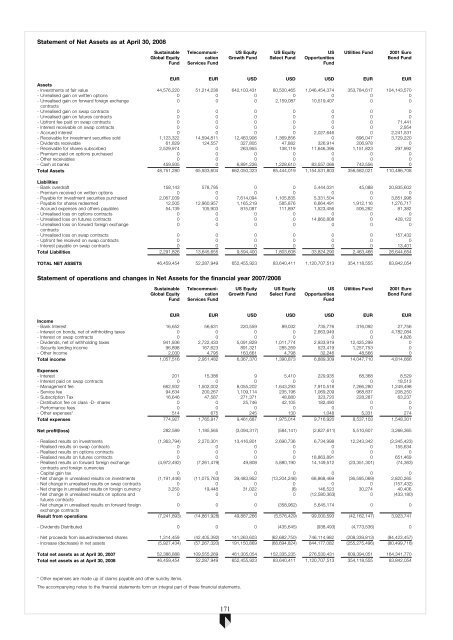
Statement of Net Assets as at April 30, 2008<br />
Sustainable<br />
Global Equity<br />
Fund<br />
Tele<strong>com</strong>munication<br />
Services Fund<br />
US Equity<br />
Growth Fund<br />
US Equity<br />
Select Fund<br />
US<br />
Opportunities<br />
Fund<br />
Utilities Fund<br />
2001 Euro<br />
Bond Fund<br />
EUR EUR USD USD USD EUR EUR<br />
Assets<br />
- Investments at fair value 44,576,220 51,214,236 642,103,431 80,500,465 1,046,454,374 353,784,617 104,143,570<br />
- Unrealised gain on written options 0 0 0 0 0 0 0<br />
- Unrealised gain on forward foreign exchange<br />
0 0 0 2,159,087 10,519,407 0 0<br />
contracts<br />
- Unrealised gain on swap contracts 0 0 0 0 0 0 0<br />
- Unrealised gain on futures contracts 0 0 0 0 0 0 0<br />
- Upfront fee paid on swap contracts 0 0 0 0 0 0 71,441<br />
- Interest receivable on swap contracts 0 0 0 0 0 0 2,954<br />
- Accrued interest 0 0 0 0 2,027,646 0 2,241,531<br />
- Receivable for investment securities sold 1,123,322 14,594,811 12,463,906 1,369,856 0 696,047 3,729,220<br />
- Dividends receivable 61,829 124,557 327,805 47,882 326,914 206,978 0<br />
- Receivable for shares subscribed 2,529,974 0 263,955 138,119 11,646,396 1,151,823 297,992<br />
- Premium paid on options purchased 0 0 0 0 0 0 0<br />
- Other receivables 0 0 0 0 0 0 0<br />
- Cash at banks 459,935 0 6,891,226 1,228,610 83,557,066 742,556 0<br />
Total Assets 48,751,280 65,933,604 662,050,323 85,444,019 1,154,531,803 356,582,021 110,486,708<br />
Liabilities<br />
- Bank overdraft 158,143 578,795 0 0 5,444,031 45,088 20,835,602<br />
- Premium received on written options 0 0 0 0 0 0 0<br />
- Payable for investment securities purchased 2,067,039 0 7,614,094 1,105,835 5,331,504 0 3,851,998<br />
- Payable for shares redeemed 12,505 12,960,957 1,165,219 585,876 6,664,491 1,912,116 1,276,717<br />
- Accrued expenses and others payables 54,139 105,903 815,087 111,897 1,523,456 506,262 81,382<br />
- Unrealised loss on options contracts 0 0 0 0 0 0 0<br />
- Unrealised loss on futures contracts 0 0 0 0 14,860,808 0 428,122<br />
- Unrealised loss on forward foreign exchange<br />
0 0 0 0 0 0 0<br />
contracts<br />
- Unrealised loss on swap contracts 0 0 0 0 0 0 157,432<br />
- Upfront fee received on swap contracts 0 0 0 0 0 0 0<br />
- Interest payable on swap contracts 0 0 0 0 0 0 13,401<br />
Total Liabilities 2,291,826 13,645,655 9,594,400 1,803,608 33,824,290 2,463,466 26,644,654<br />
TOTAL NET ASSETS 46,459,454 52,287,949 652,455,923 83,640,411 1,120,707,513 354,118,555 83,842,054<br />
Statement of operations and changes in Net Assets for the financial year 2007/2008<br />
Sustainable<br />
Global Equity<br />
Fund<br />
Tele<strong>com</strong>munication<br />
Services Fund<br />
US Equity<br />
Growth Fund<br />
US Equity<br />
Select Fund<br />
US<br />
Opportunities<br />
Fund<br />
Utilities Fund<br />
2001 Euro<br />
Bond Fund<br />
EUR EUR USD USD USD EUR EUR<br />
In<strong>com</strong>e<br />
- Bank Interest 16,652 56,631 220,559 89,032 735,776 316,092 27,756<br />
- Interest on bonds, net of withholding taxes 0 0 0 0 2,663,949 0 4,782,084<br />
- Interest on swap contracts 0 0 0 0 0 0 4,826<br />
- Dividends, net of withholding taxes 941,936 2,722,433 5,091,829 1,011,774 2,933,919 12,425,299 0<br />
- Security lending in<strong>com</strong>e 96,898 167,623 891,321 285,269 523,419 1,257,753 0<br />
- Other In<strong>com</strong>e 2,030 4,795 163,661 4,798 32,246 48,566 0<br />
Total in<strong>com</strong>e 1,057,516 2,951,482 6,367,370 1,390,873 6,889,309 14,047,710 4,814,666<br />
Expenses<br />
- Interest 201 15,386 9 5,410 229,935 68,368 8,529<br />
- Interest paid on swap contracts 0 0 0 0 0 0 18,513<br />
- Management fee 662,932 1,502,002 8,055,202 1,643,293 7,910,518 7,266,280 1,249,498<br />
- Service fee 94,634 200,267 1,109,114 235,196 1,069,209 968,837 208,250<br />
- Subscription Tax 16,646 47,587 271,371 48,880 323,720 228,287 63,237<br />
- Distribution fee on class -D- shares 0 0 25,746 42,105 182,490 0 0<br />
- Performance fees 0 0 0 0 0 0 0<br />
- Other expenses* 514 675 245 130 1,048 5,331 274<br />
Total expenses 774,927 1,765,917 9,461,687 1,975,014 9,716,920 8,537,103 1,548,301<br />
Net profit(loss) 282,589 1,185,565 (3,094,317) (584,141) (2,827,611) 5,510,607 3,266,365<br />
- Realised results on investments (1,363,794) 2,270,301 13,416,801 2,690,736 6,734,998 12,243,342 (2,345,423)<br />
- Realised results on swap contracts 0 0 0 0 0 0 155,634<br />
- Realised results on options contracts 0 0 0 0 0 0 0<br />
- Realised results on futures contracts 0 0 0 0 18,863,891 0 651,469<br />
- Realised results on forward foreign exchange<br />
(4,972,492) (7,261,479) 49,808 5,880,190 14,149,512 (23,351,301) (74,363)<br />
contracts and foreign currencies<br />
- Capital gain tax 0 0 0 0 0 0 0<br />
- Net change in unrealised results on investments (1,191,446) (11,075,763) 39,483,952 (13,204,246) 68,868,469 (36,595,069) 2,820,265<br />
- Net change in unrealised results on swap contracts 0 0 0 0 0 0 (157,432)<br />
- Net change in unrealised results on foreign currency 3,250 19,448 31,022 (6) 146,523 30,274 40,406<br />
- Net change in unrealised results on options and<br />
0 0 0 0 (12,580,363) 0 (433,180)<br />
futures contracts<br />
- Net change in unrealised results on forward foreign<br />
0 0 0 (358,962) 5,645,174 0 0<br />
exchange contracts<br />
Result from operations (7,241,893) (14,861,928) 49,887,266 (5,576,429) 99,000,593 (42,162,147) 3,923,741<br />
- Dividends Distributed 0 0 0 (435,645) (938,493) (4,773,536) 0<br />
- Net proceeds from issued/redeemed shares 1,314,459 (42,405,392) 141,263,603 (62,682,750) 746,114,982 (208,339,813) (84,423,457)<br />
- Increase (decrease) in net assets (5,927,434) (57,267,320) 191,150,869 (68,694,824) 844,177,082 (255,275,496) (80,499,716)<br />
Total Exchange net assets Difference as at April 30, 2007 52,386,888 109,555,269 461,305,054 152,335,235 276,530,431 609,394,051 164,341,770<br />
Total net assets as at April 30, 2008 46,459,454 52,287,949 652,455,923 83,640,411 1,120,707,513 354,118,555 83,842,054<br />
* Other expenses are made up of claims payable and other sundry items.<br />
The ac<strong>com</strong>panying notes to the financial statements form an integral part of these financial statements.<br />
171