ABN AMRO Funds - Aia.com.hk
ABN AMRO Funds - Aia.com.hk
ABN AMRO Funds - Aia.com.hk

You also want an ePaper? Increase the reach of your titles
YUMPU automatically turns print PDFs into web optimized ePapers that Google loves.
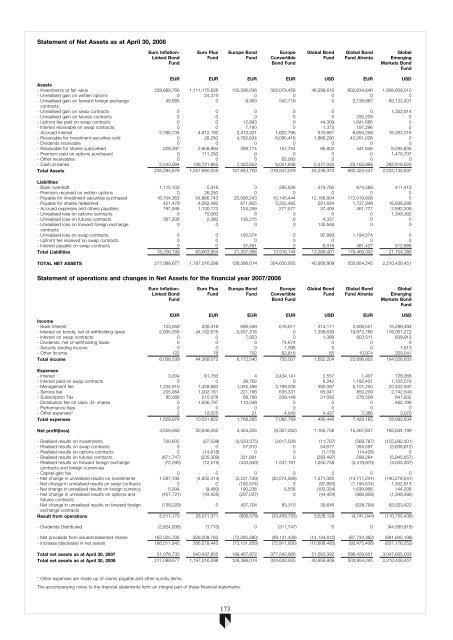
Statement of Net Assets as at April 30, 2008<br />
Euro Inflation-<br />
Linked Bond<br />
Fund<br />
Euro Plus<br />
Fund<br />
Europe Bond<br />
Fund<br />
Europe<br />
Convertible<br />
Bond Fund<br />
Global Bond<br />
Fund<br />
Global Bond<br />
Fund Alrenta<br />
Global<br />
Emerging<br />
Markets Bond<br />
Fund<br />
EUR EUR EUR EUR USD EUR USD<br />
Assets<br />
- Investments at fair value 229,689,766 1,111,175,626 132,596,036 302,079,456 46,299,612 602,634,640 1,838,809,010<br />
- Unrealised gain on written options 0 24,375 0 0 0 0 0<br />
- Unrealised gain on forward foreign exchange<br />
46,885 0 9,900 542,716 0 2,136,887 83,122,431<br />
contracts<br />
- Unrealised gain on swap contracts 0 0 0 0 0 0 1,352,914<br />
- Unrealised gain on futures contracts 0 0 0 0 0 250,209 0<br />
- Upfront fee paid on swap contracts 0 0 12,893 0 44,309 1,641,685 0<br />
- Interest receivable on swap contracts 0 0 7,190 0 1,373 197,296 0<br />
- Accrued interest 2,786,734 4,812,192 2,413,321 1,622,796 570,891 8,694,258 16,263,316<br />
- Receivable for investment securities sold 0 26,250 4,782,534 6,080,416 1,866,290 42,261,028 0<br />
- Dividends receivable 0 0 0 0 0 0 0<br />
- Receivable for shares subscribed 228,397 2,808,894 399,174 157,754 86,803 441,646 8,295,830<br />
- Premium paid on options purchased 0 111,250 0 0 0 0 1,470,707<br />
- Other receivables 0 0 0 62,093 0 0 0<br />
- Cash at banks 2,543,094 138,721,665 7,422,652 8,001,848 5,377,032 22,165,898 282,818,629<br />
Total Assets 235,294,876 1,257,680,252 147,643,700 318,547,079 54,246,310 680,423,547 2,232,132,837<br />
Liabilities<br />
- Bank overdraft 1,115,103 5,916 0 295,638 319,760 674,568 411,410<br />
- Premium received on written options 0 26,250 0 0 0 0 0<br />
- Payable for investment securities purchased 16,104,363 54,866,743 20,096,243 10,140,444 12,156,804 172,019,608 0<br />
- Payable for shares redeemed 421,479 4,562,492 671,805 3,202,485 521,634 1,737,348 16,838,286<br />
- Accrued expenses and others payables 197,946 1,130,173 124,258 277,577 37,409 461,777 2,592,309<br />
- Unrealised loss on options contracts 0 70,000 0 0 0 0 1,349,392<br />
- Unrealised loss on futures contracts 367,308 2,380 135,315 0 4,337 0 0<br />
- Unrealised loss on forward foreign exchange<br />
0 0 0 0 145,546 0 0<br />
contracts<br />
- Unrealised loss on swap contracts 0 0 192,574 0 97,893 1,194,574 0<br />
- Upfront fee received on swap contracts 0 0 0 0 0 0 0<br />
- Interest payable on swap contracts 0 0 37,491 0 6,018 381,427 512,989<br />
Total Liabilities 18,206,199 60,663,954 21,257,686 13,916,144 13,289,401 176,469,302 21,704,386<br />
TOTAL NET ASSETS 217,088,677 1,197,016,298 126,386,014 304,630,935 40,956,909 503,954,245 2,210,428,451<br />
Statement of operations and changes in Net Assets for the financial year 2007/2008<br />
Euro Inflation-<br />
Linked Bond<br />
Fund<br />
Euro Plus<br />
Fund<br />
Europe Bond<br />
Fund<br />
Europe<br />
Convertible<br />
Bond Fund<br />
Global Bond<br />
Fund<br />
Global Bond<br />
Fund Alrenta<br />
Global<br />
Emerging<br />
Markets Bond<br />
Fund<br />
EUR EUR EUR EUR USD EUR USD<br />
In<strong>com</strong>e<br />
- Bank Interest 103,058 235,318 606,599 616,817 314,111 2,008,551 15,288,494<br />
- Interest on bonds, net of withholding taxes 5,935,359 44,132,678 5,557,316 0 1,336,639 19,873,766 178,061,272<br />
- Interest on swap contracts 0 0 7,923 0 1,389 803,511 839,913<br />
- Dividends, net of withholding taxes 0 0 0 74,674 0 0 0<br />
- Security lending in<strong>com</strong>e 0 0 0 1,398 0 0 7,613<br />
- Other In<strong>com</strong>e 122 76 702 62,618 65 10,974 329,541<br />
Total in<strong>com</strong>e 6,038,539 44,368,072 6,172,540 755,507 1,652,204 22,696,802 194,526,833<br />
Expenses<br />
- Interest 3,034 61,783 4 2,434,141 2,557 1,407 728,368<br />
- Interest paid on swap contracts 0 0 39,762 0 6,242 1,192,401 1,705,579<br />
- Management fee 1,234,910 7,428,680 1,325,496 3,799,208 390,087 5,101,253 22,402,937<br />
- Service fee 205,964 1,002,161 221,166 635,331 65,041 850,209 2,742,549<br />
- Subscription Tax 85,066 510,376 68,788 209,149 21,092 276,509 847,932<br />
- Distribution fee on class -D- shares 0 1,506,797 113,048 0 0 0 462,199<br />
- Performance fees 0 0 0 0 0 0 0<br />
- Other expenses* 2 12,025 21 4,940 4,427 7,386 3,070<br />
Total expenses 1,528,976 10,521,822 1,768,285 7,082,769 489,446 7,429,165 28,892,634<br />
Net profit(loss) 4,509,563 33,846,250 4,404,255 (6,327,262) 1,162,758 15,267,637 165,634,199<br />
- Realised results on investments 700,605 (27,038) (3,033,375) 3,617,029 (11,707) (568,787) (155,292,301)<br />
- Realised results on swap contracts 0 0 57,910 0 54,677 394,597 (3,838,812)<br />
- Realised results on options contracts 0 (14,818) 0 0 (1,175) (14,426) 0<br />
- Realised results on futures contracts (671,747) (235,309) 321,891 0 (293,497) 298,264 (5,945,657)<br />
- Realised results on forward foreign exchange<br />
(72,590) (12,515) (433,849) 1,237,181 1,250,758 (4,419,870) (4,505,307)<br />
contracts and foreign currencies<br />
- Capital gain tax 0 0 0 0 0 0 0<br />
- Net change in unrealised results on investments 1,587,195 (4,932,314) (2,231,739) (32,074,569) 1,571,320 (14,717,241) (190,278,541)<br />
- Net change in unrealised results on swap contracts 0 0 (192,574) 0 (97,893) (1,194,574) 1,352,913<br />
- Net change in unrealised results on foreign currency 5,094 (9,460) 190,236 5,556 (102,334) 1,638,956 144,038<br />
- Net change in unrealised results on options and<br />
(407,721) (43,425) (297,037) 0 (44,424) (886,806) (1,349,392)<br />
futures contracts<br />
- Net change in unrealised results on forward foreign (139,229) 0 407,704 83,310 39,646 (538,794) 83,323,422<br />
exchange contracts<br />
Result from operations 5,511,170 28,571,371 (806,578) (33,458,755) 3,528,129 (4,741,044) (110,755,438)<br />
- Dividends Distributed (2,824,936) (1,710) 0 (311,747) 0 0 (44,580,918)<br />
- Net proceeds from issued/redeemed shares 163,325,708 328,008,782 (72,295,280) (39,141,428) (14,134,612) (87,734,362) (681,840,196)<br />
- Increase (decrease) in net assets 166,011,942 356,578,443 (73,101,858) (72,911,930) (10,606,483) (92,475,406) (837,176,552)<br />
Total Exchange net assets Difference as at April 30, 2007 51,076,735 840,437,855 199,487,872 377,542,865 51,563,392 596,429,651 3,047,605,003<br />
Total net assets as at April 30, 2008 217,088,677 1,197,016,298 126,386,014 304,630,935 40,956,909 503,954,245 2,210,428,451<br />
* Other expenses are made up of claims payable and other sundry items.<br />
The ac<strong>com</strong>panying notes to the financial statements form an integral part of these financial statements.<br />
173