
You also want an ePaper? Increase the reach of your titles
YUMPU automatically turns print PDFs into web optimized ePapers that Google loves.
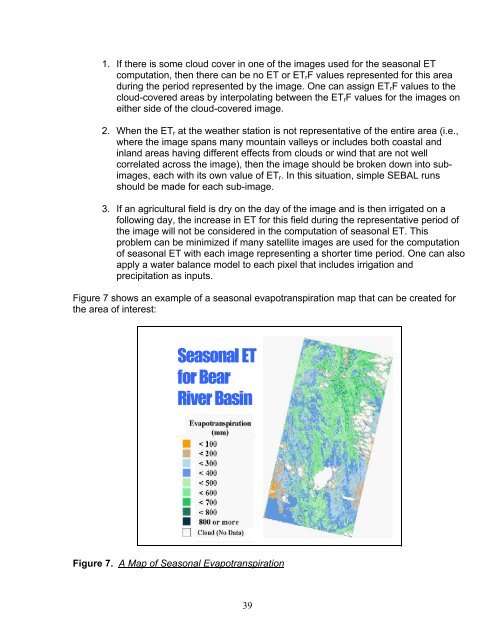
1. If there is some cloud cover in one of the images used for the seasonal ETcomputation, then there can be no ET or ET r F values represented for this areaduring the period represented by the image. One can assign ET r F values to thecloud-covered areas by interpolating between the ET r F values for the images oneither side of the cloud-covered image.2. When the ET r at the weather station is not representative of the entire area (i.e.,where the image spans many mountain valleys or includes both coastal andinland areas having different effects from clouds or wind that are not wellcorrelated across the image), then the image should be <strong>br</strong>oken down into subimages,each with its own value of ET r . In this situation, simple <strong>SEBAL</strong> runsshould be made for each sub-image.3. If an agricultural field is dry on the day of the image and is then irrigated on afollowing day, the increase in ET for this field during the representative period ofthe image will not be considered in the computation of seasonal ET. Thisproblem can be minimized if many satellite images are used for the computationof seasonal ET with each image representing a shorter time period. One can alsoapply a water balance model to each pixel that includes irrigation andprecipitation as inputs.Figure 7 shows an example of a seasonal evapotranspiration map that can be created forthe area of interest:Seasonal ETfor BearRiver BasinFigure 7. A Map of Seasonal Evapotranspiration39